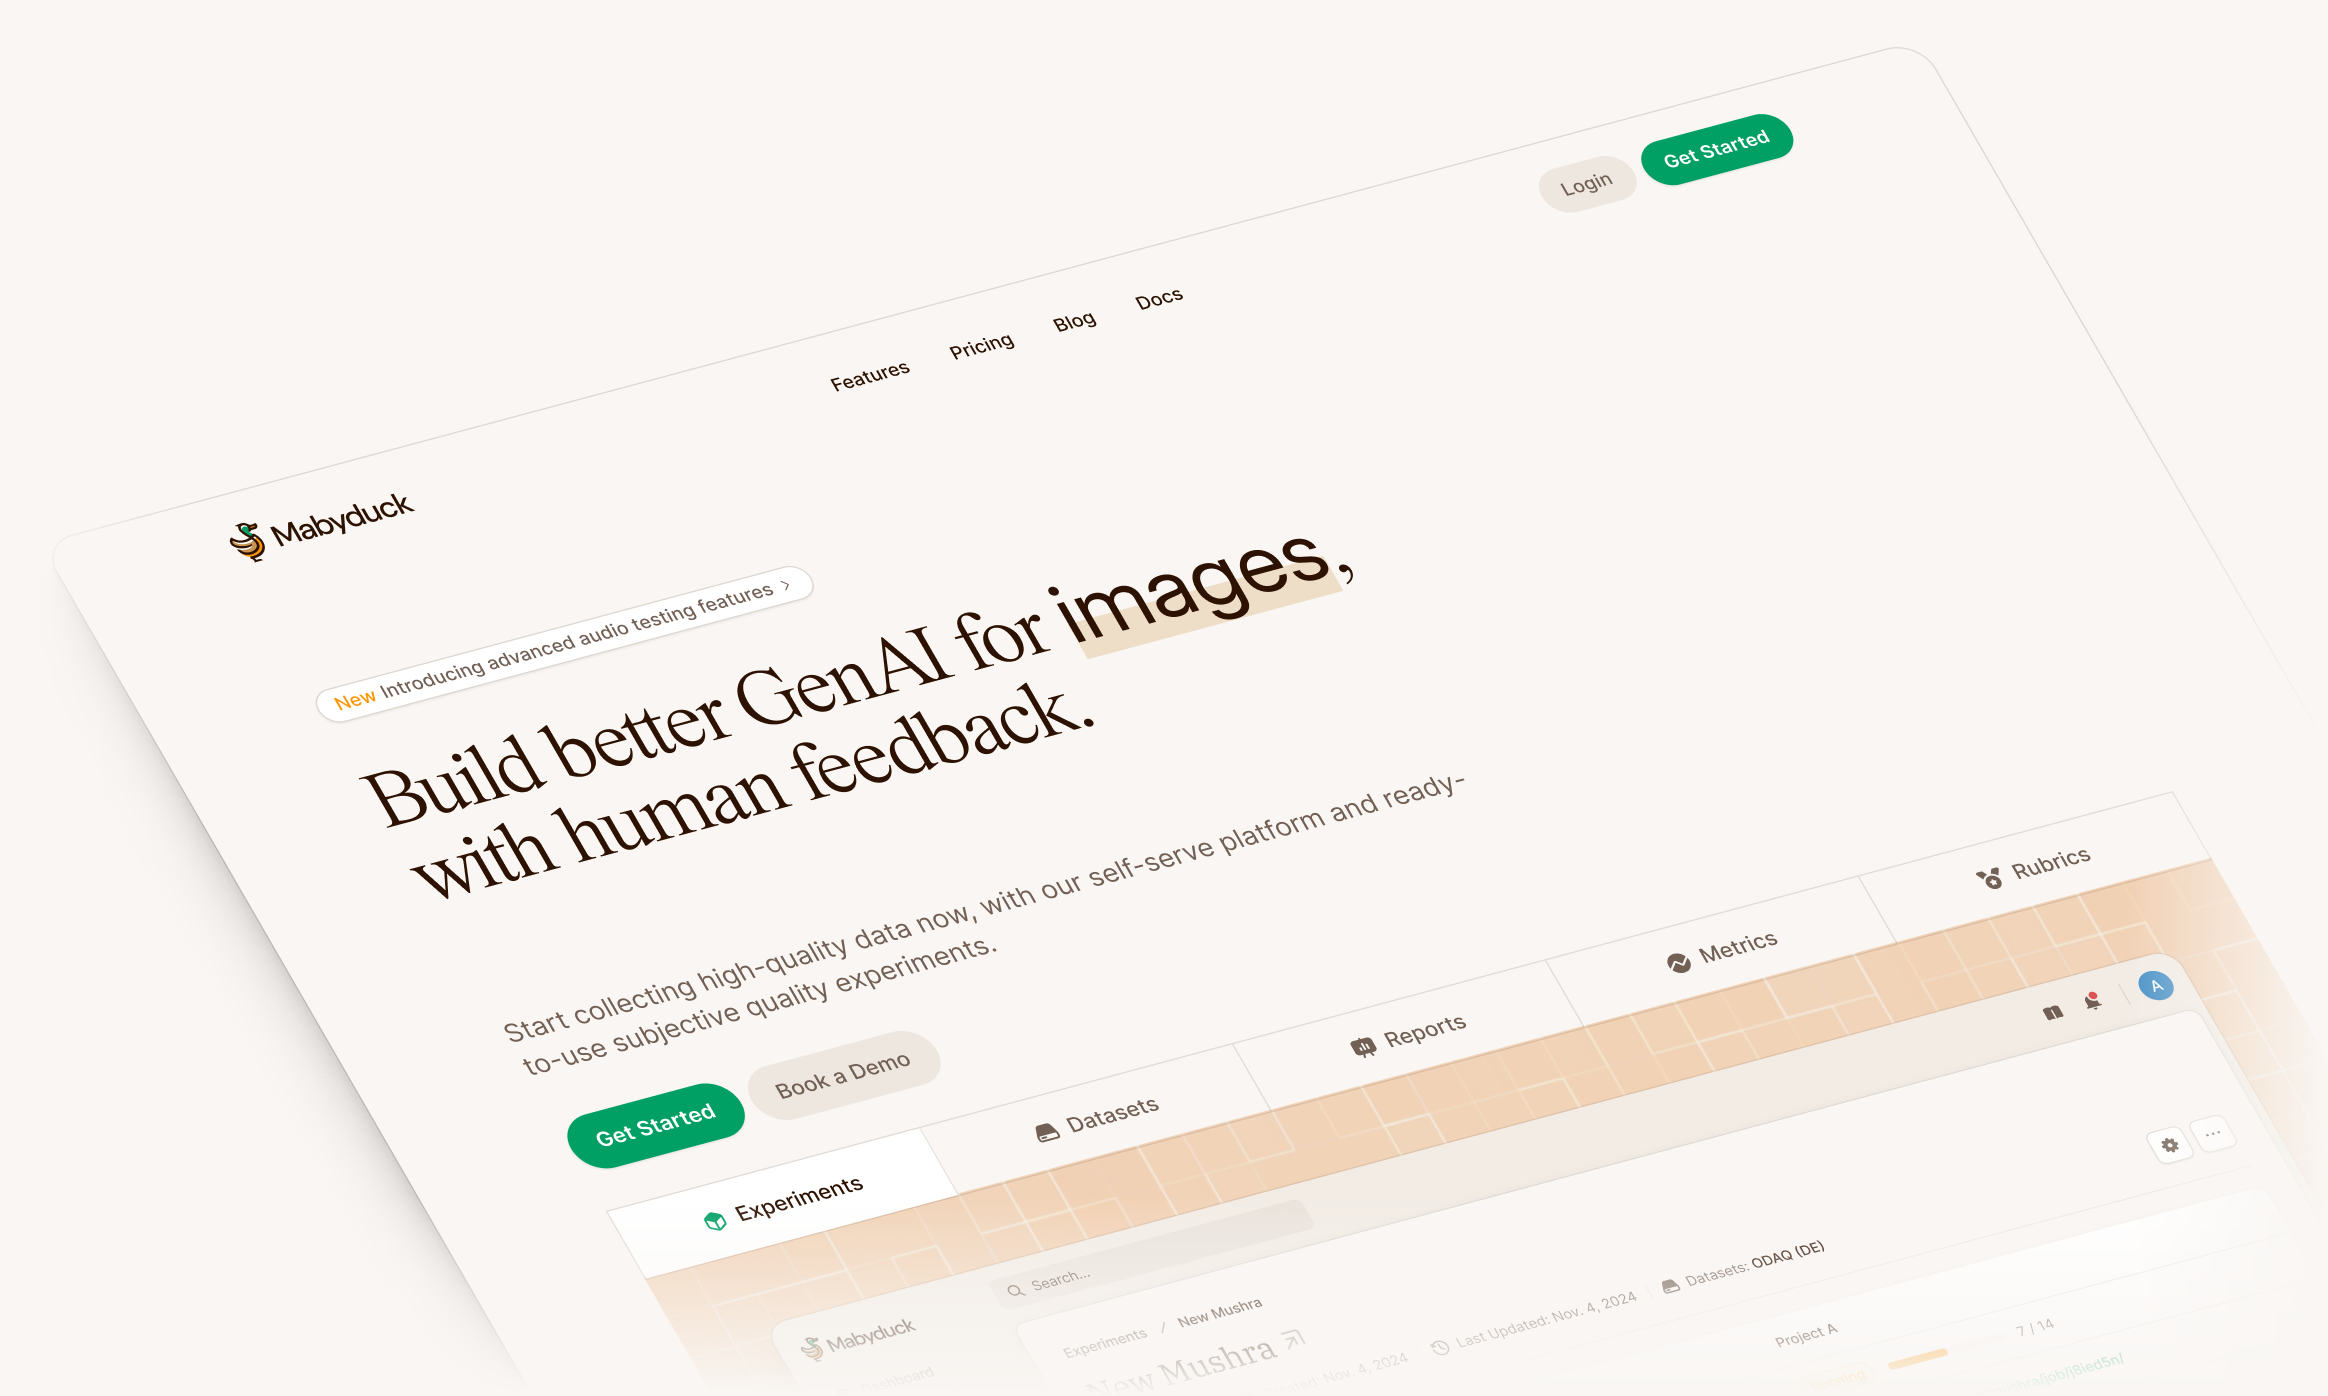
Mabyduck tells AI teams which version of their model people actually prefer. A team uploads its model's outputs, whether images, audio or video, picks an experiment type, and Mabyduck recruits the raters, checks they're paying attention, runs the statistics and returns the results.
Lucas Theis founded it after years of running these studies as a research scientist at Google. When we met in October 2024 he'd built a working version himself, and he described it as homemade. We started with a sprint on the customer interface, working with Lucas on the flows and with our designer Prakash on the visual system. Later engagements took us through results, session analysis and a separate service for recruiting raters.
A study has more ways to fail than it looks
Before Mabyduck, a human evaluation was a lab test run to an ITU standard, or a crowd study on Prolific held together with bash scripts, CSVs and email. Lucas told us that even at Google, getting good data out of one took months.
Little of that time is about the model. Raters on a VPN end up watching a transcoded copy of the video. Some click through as fast as they can. One listens on studio headphones, another on a laptop speaker.
known-answer trials help identify random clicking
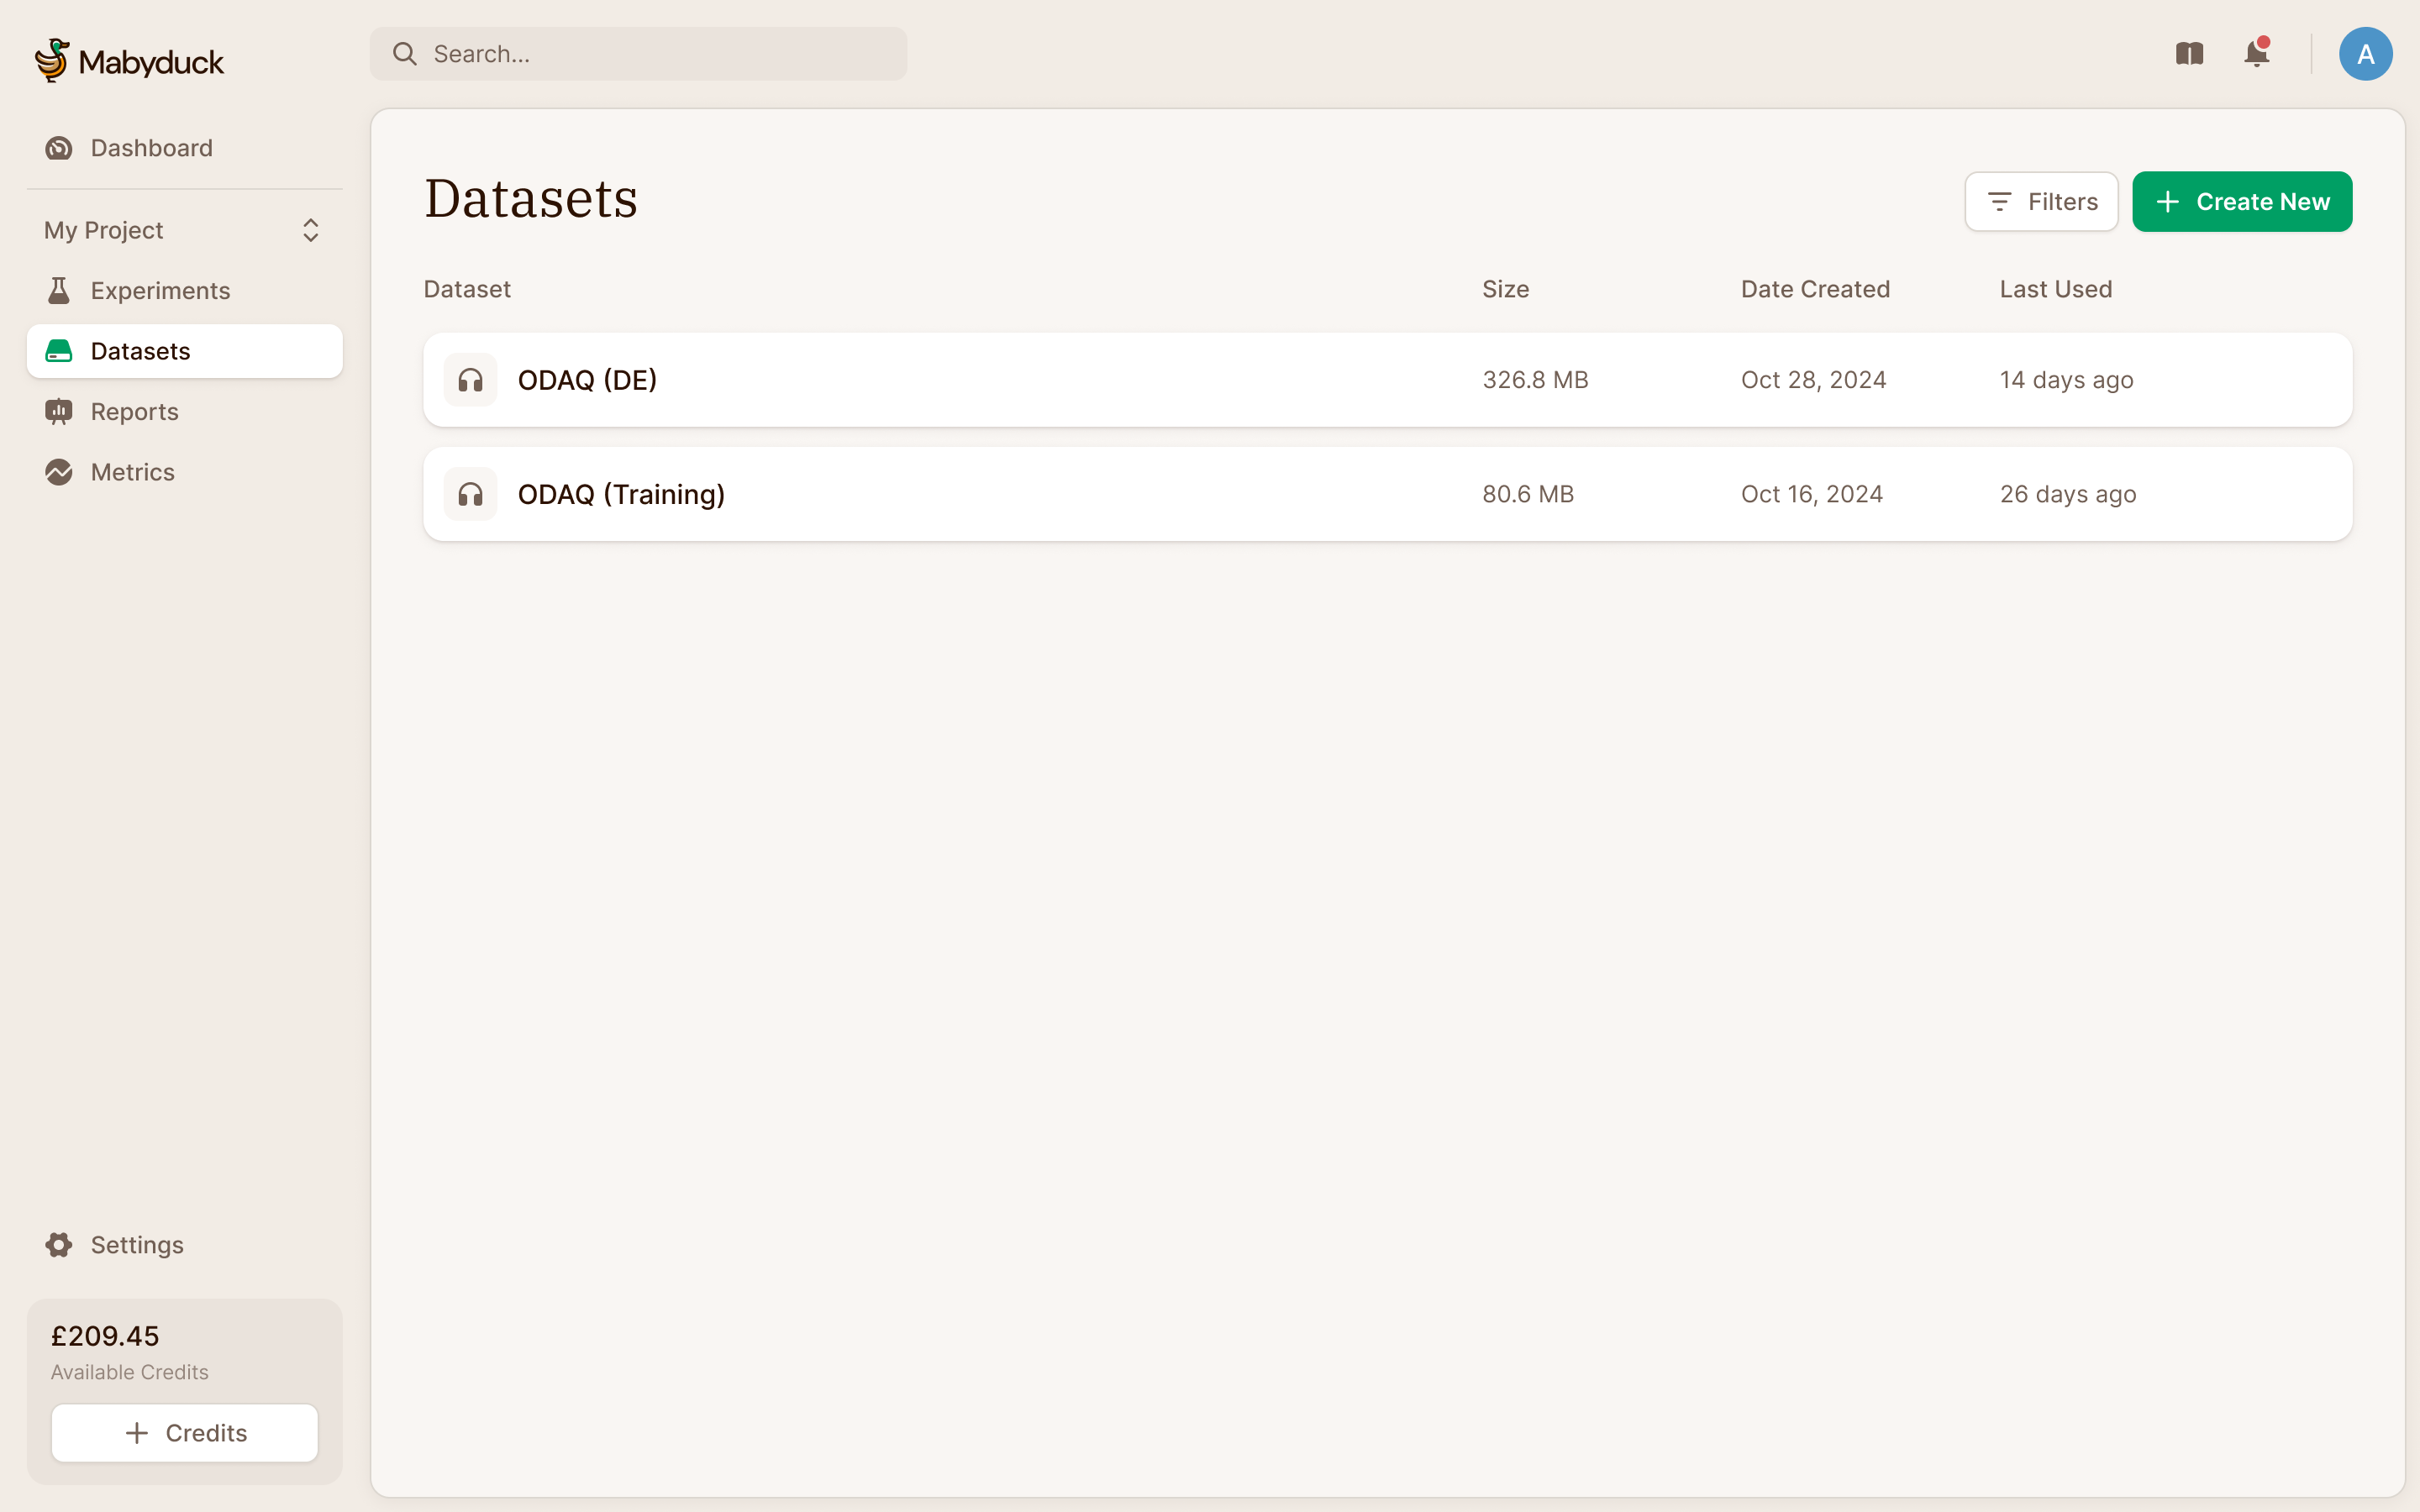
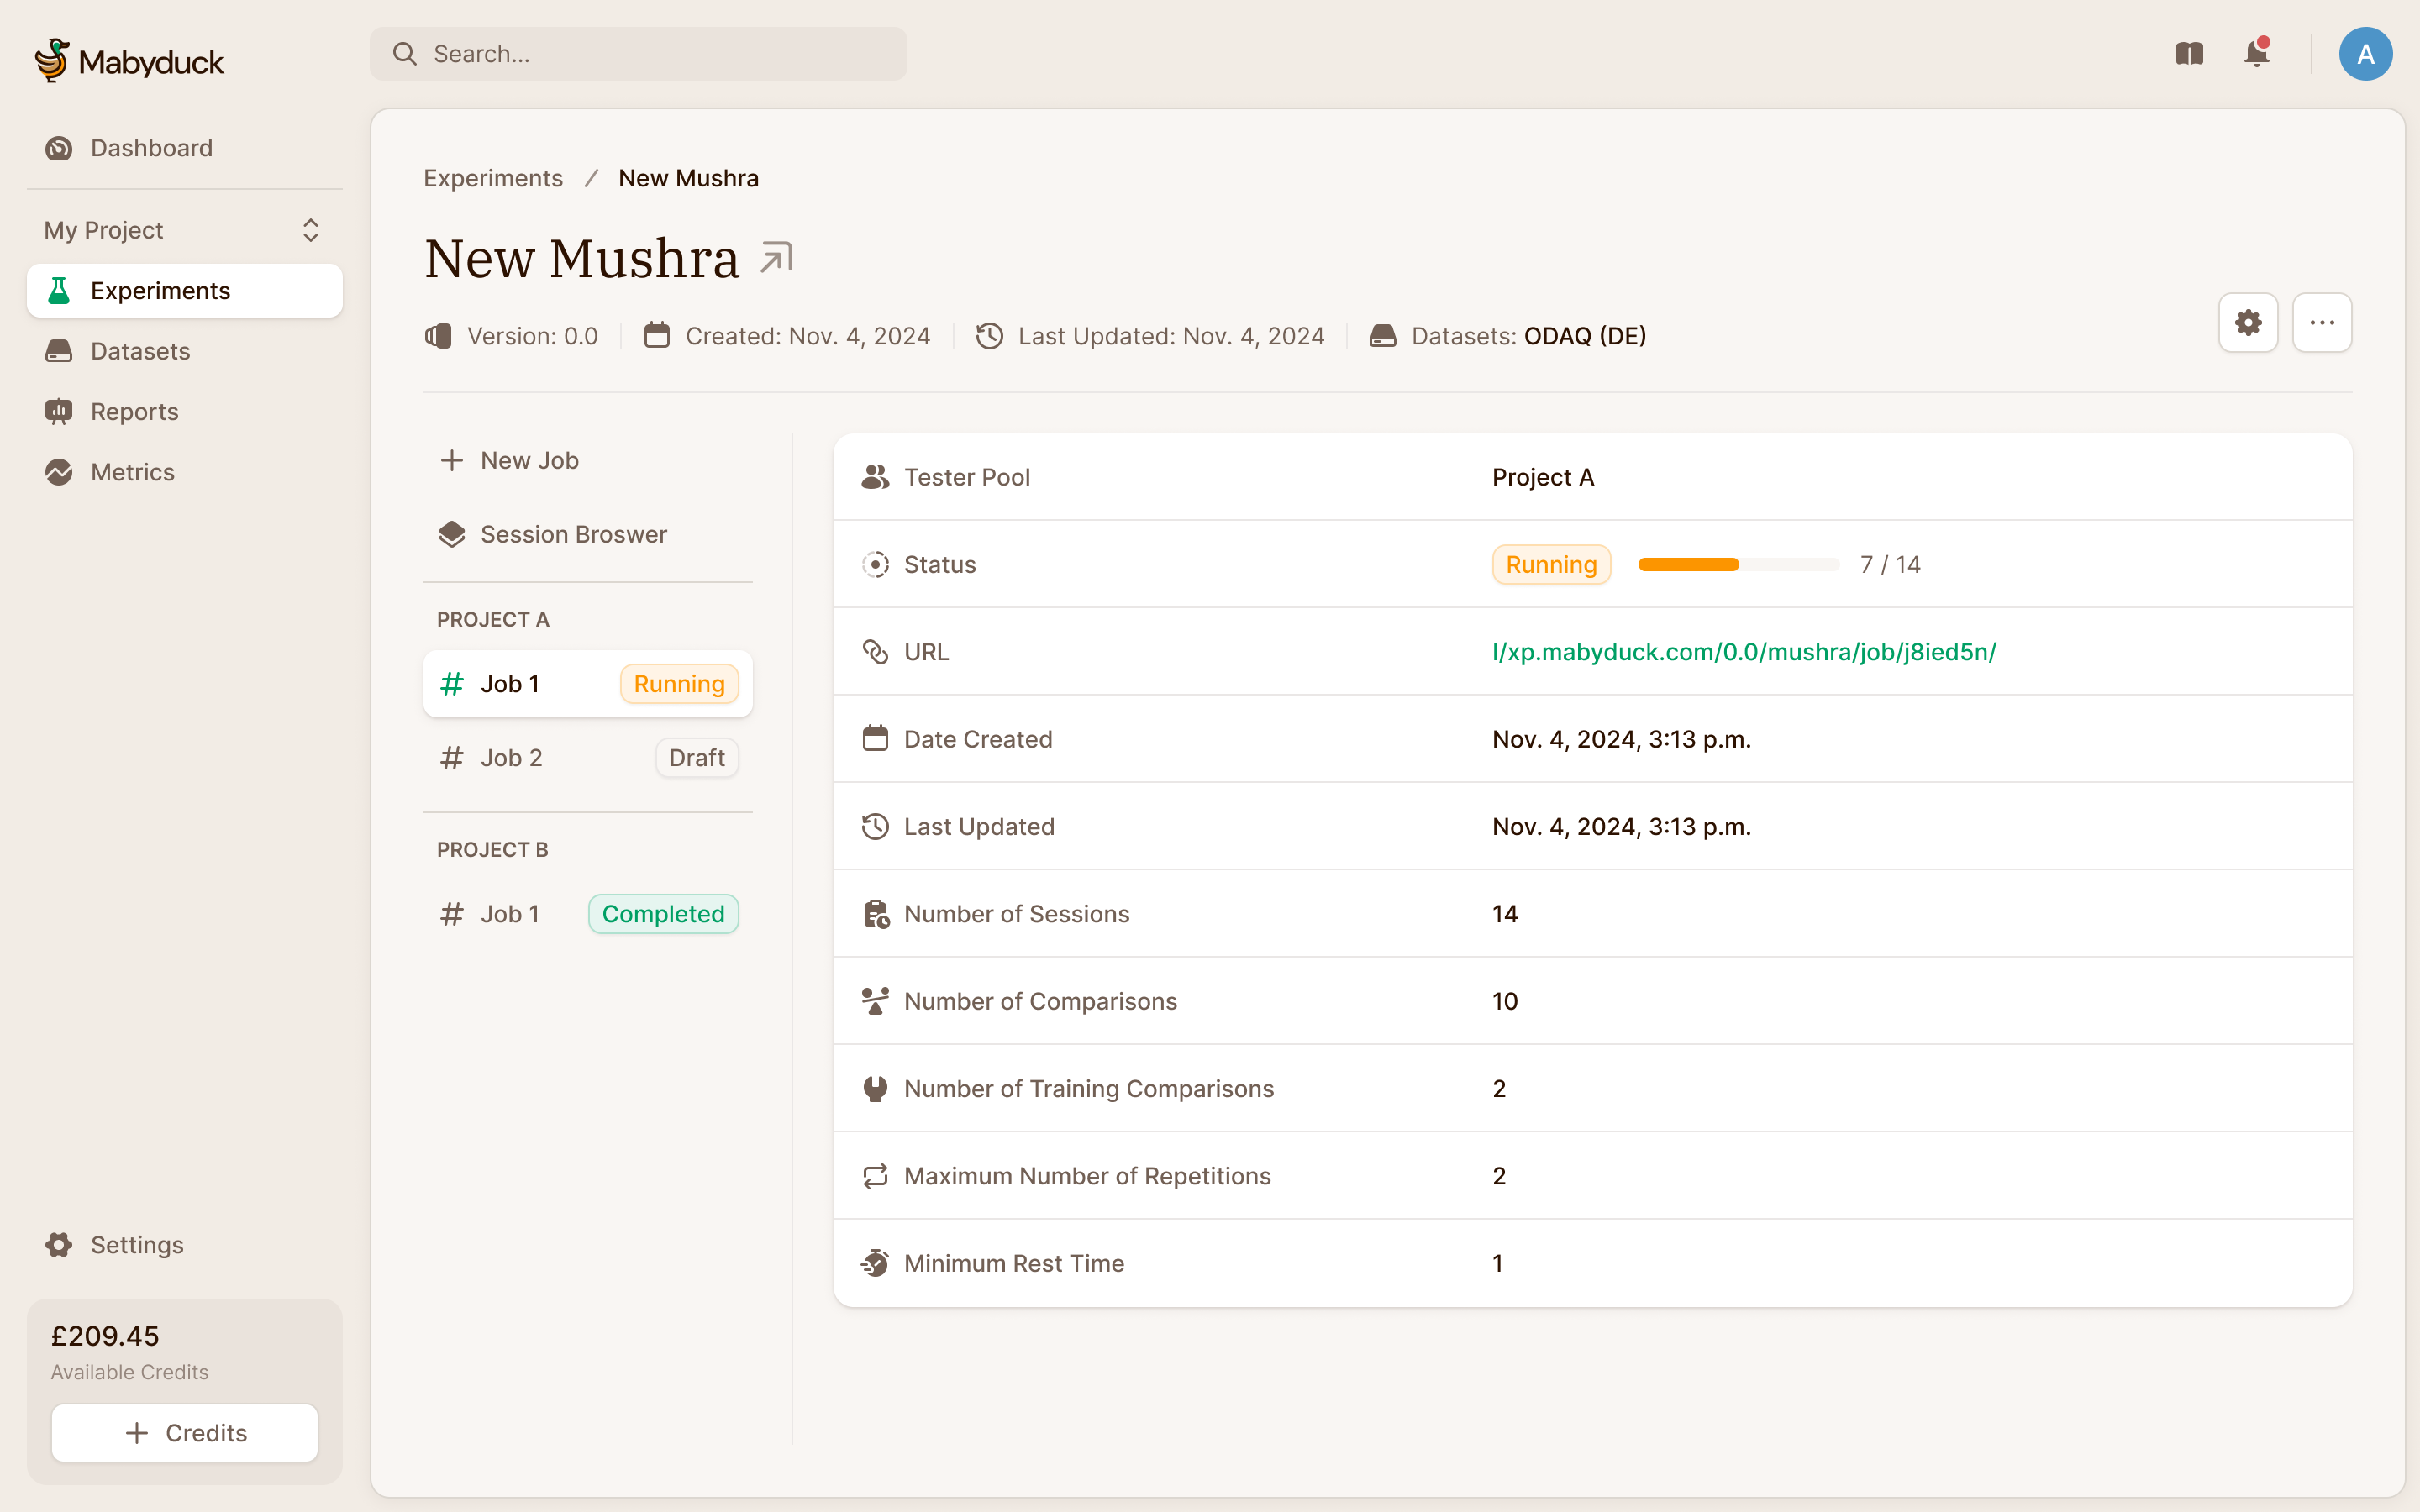
Taken apart, every study has the same parts, and the product follows them. A dataset holds the outputs to judge. An experiment applies a method to it. Each experiment runs jobs, one per pool of raters, and every rater's session is recorded on the way to the results.
A research tool with room to breathe
Lucas wanted the product to feel professional enough to put in front of researchers, without making it overwhelming or patronising. We went with a sandy, paper-like palette and serif headings, closer to a journal than a dashboard. The forms and tables use familiar component patterns. The character comes from the typography and colour, while the controls still behave like the tools researchers already use.
Put the dataset inside the experiment flow
The product model gives datasets their own section. But someone arriving to run their first study has an experiment in mind, and may not have uploaded any data yet. Requiring them to leave the experiment flow, create a dataset and find their way back would make them learn the product structure before they could use it.
I proposed putting dataset creation directly into the experiment flow, with a skip option for people who already had one. Lucas singled this out afterwards as the right choice. The dataset could still be managed separately; creating one no longer had to be a separate journey.
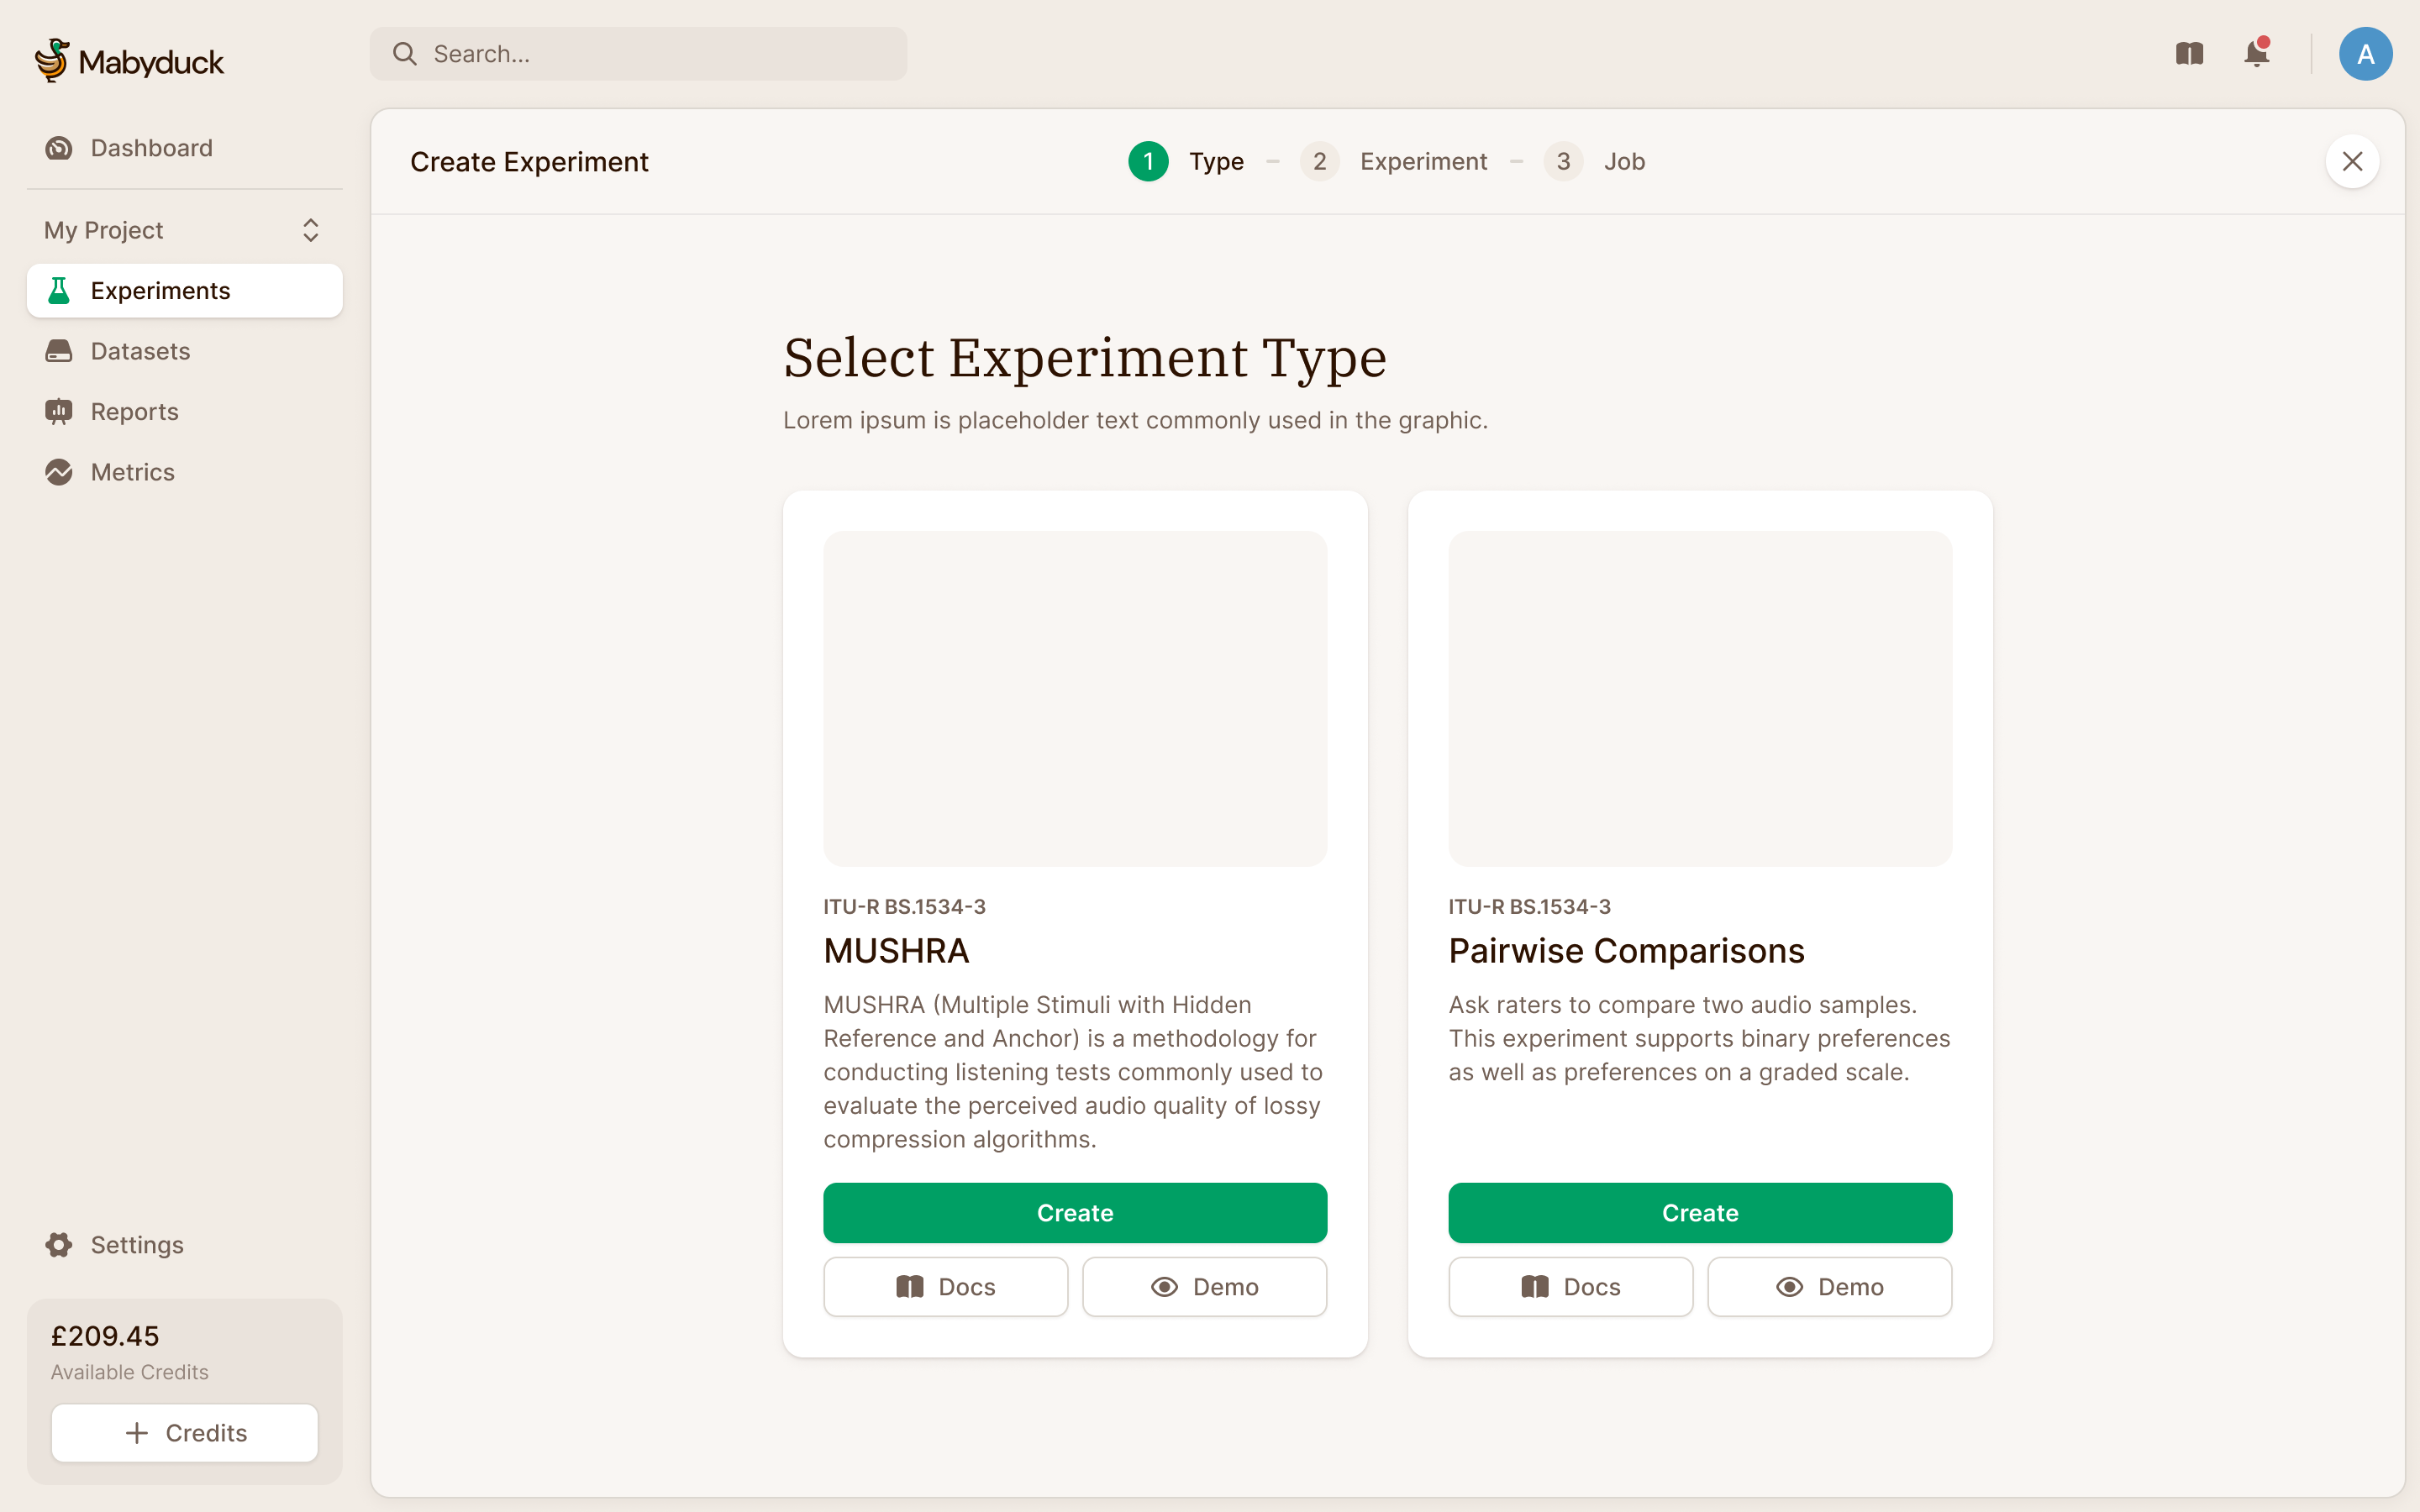
We designed the setup as full-page steps with a breadcrumb across the top. A researcher could choose the method, supply the data and configure the job in sequence. They could also save a draft before paying.
The first step is the method. In a MUSHRA test, a listener scores several versions of one clip from 0 to 100, with the original and some deliberately degraded "anchors" hidden among them to calibrate the scale. In a pairwise comparison, raters pick the better of two outputs, and enough picks add up to a ranking.
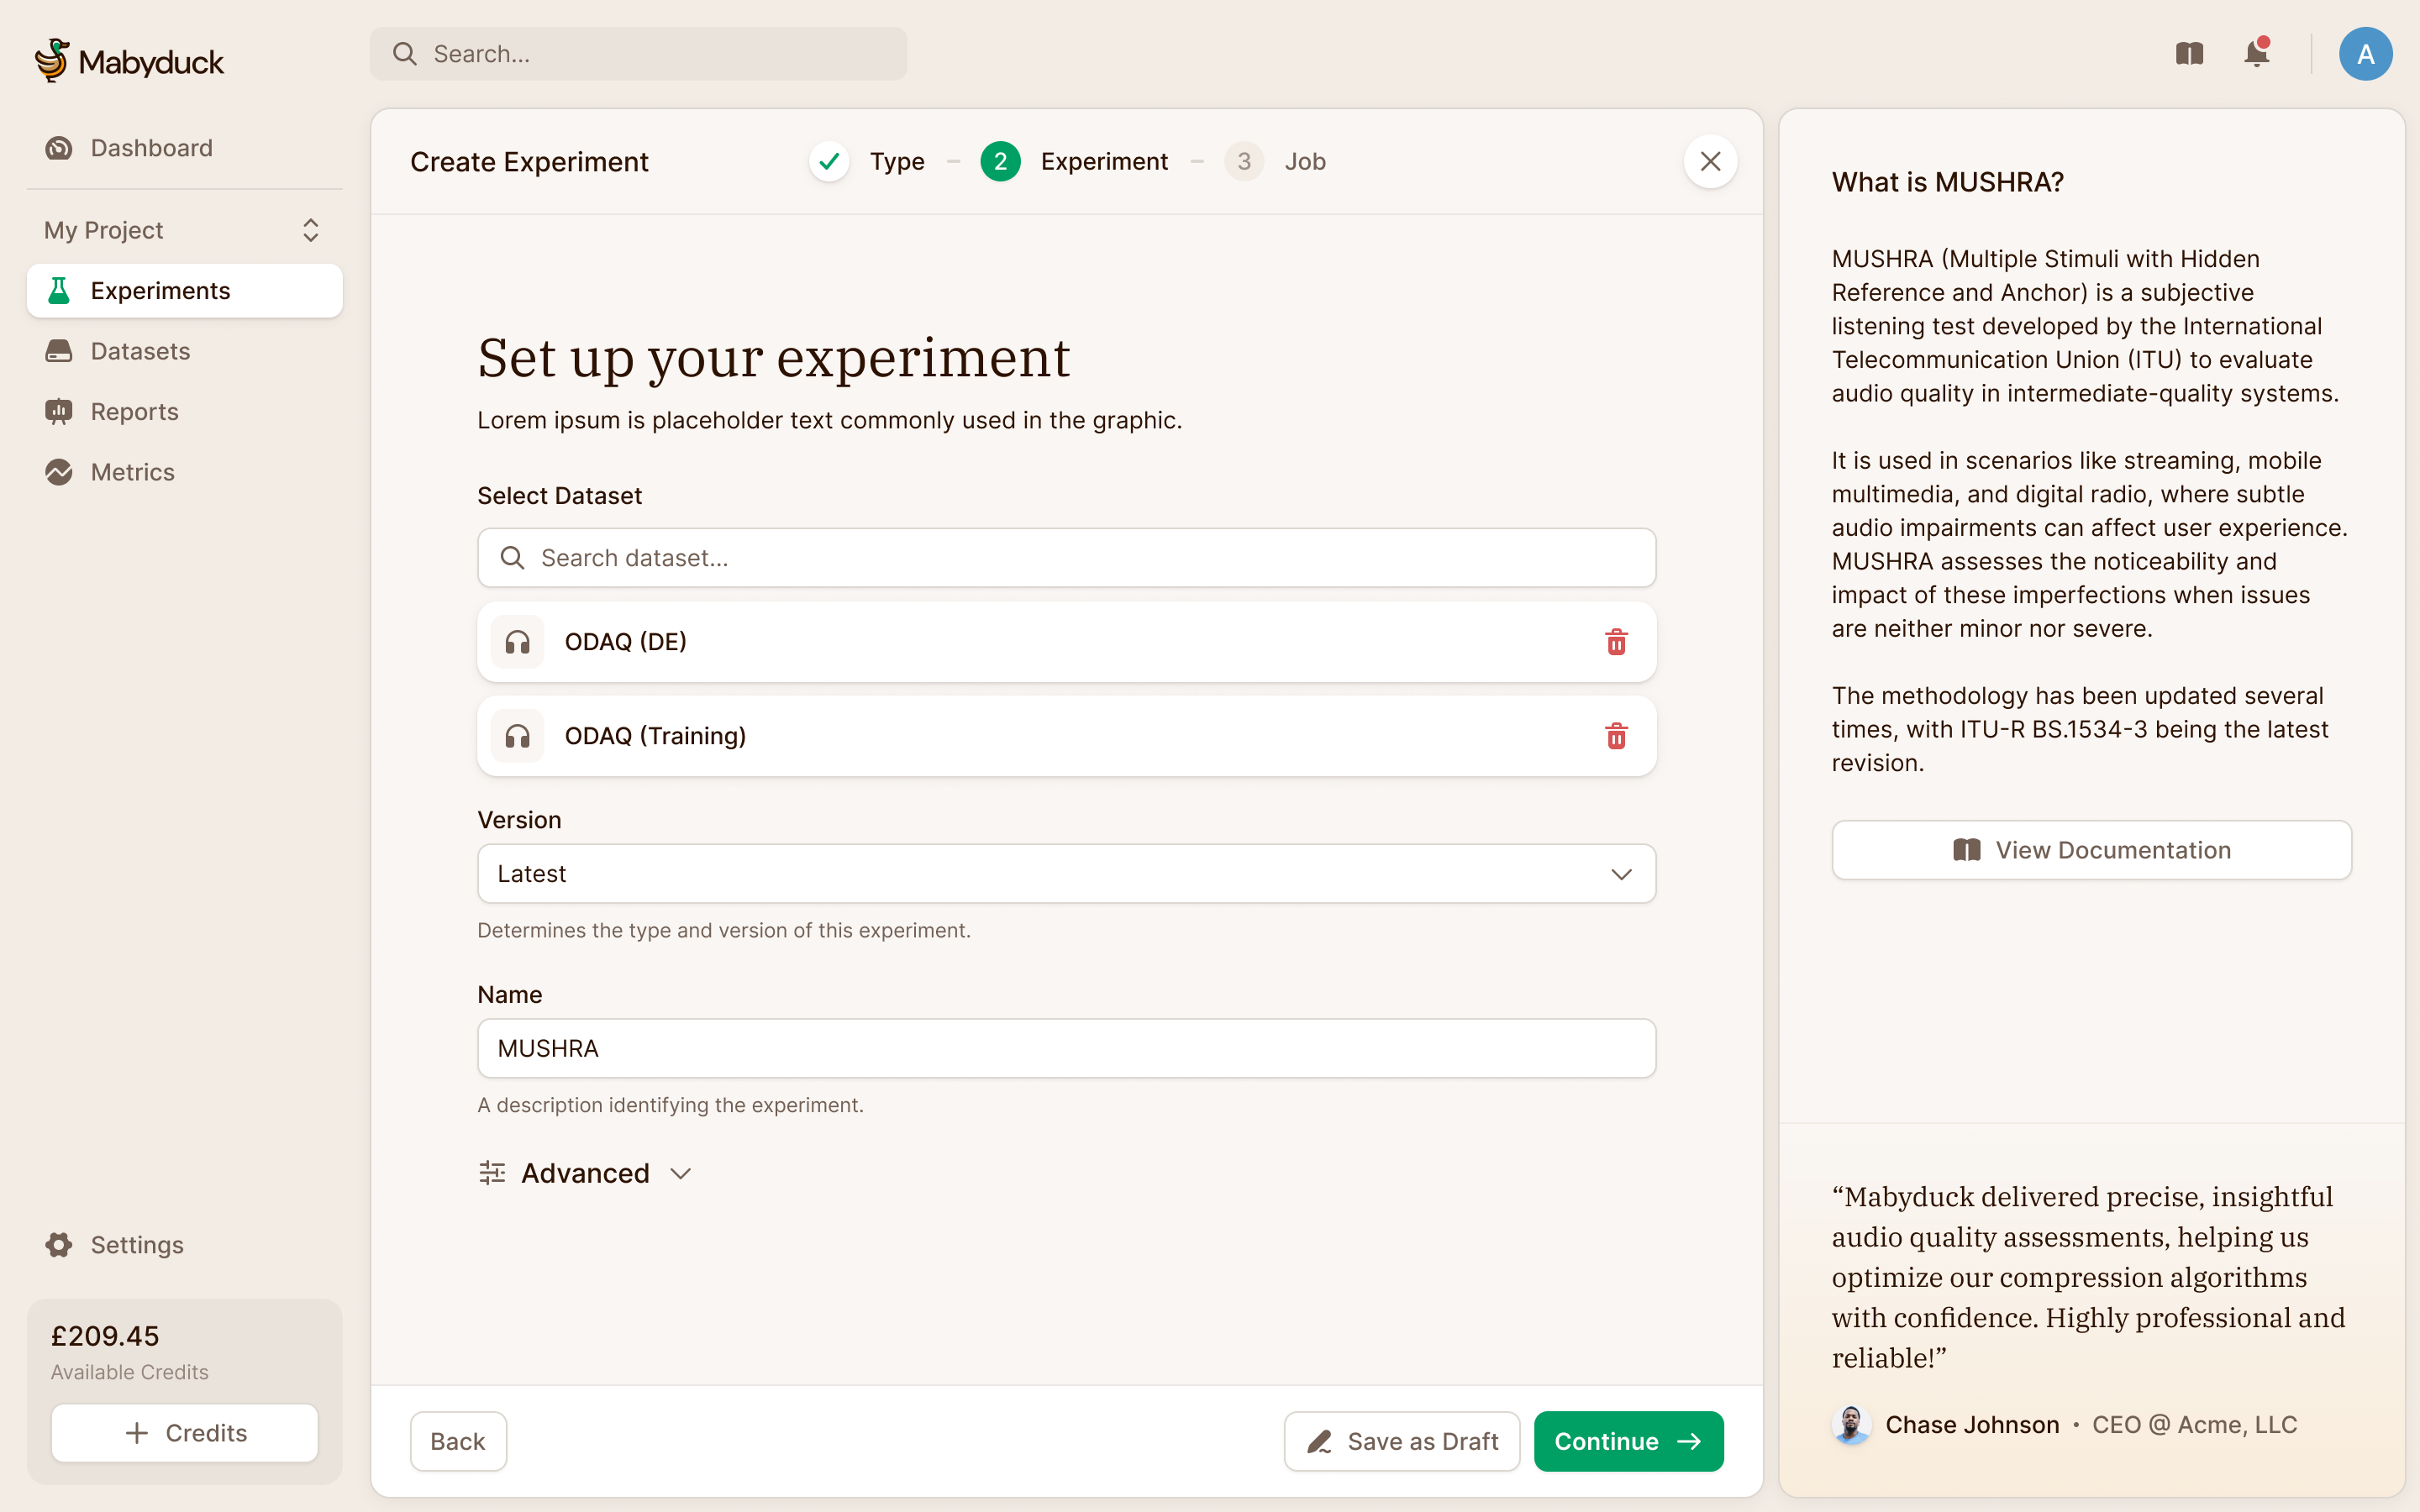
A MUSHRA dataset needs to say which file is the reference and which are the anchors. The upload form exposes that structure: a zip contains a folder for each stimulus, with the different methods inside it. Filename patterns identify references and anchors. The dataset browser then shows those roles beside the files, so the researcher can inspect how the upload has been interpreted before using it in a study.
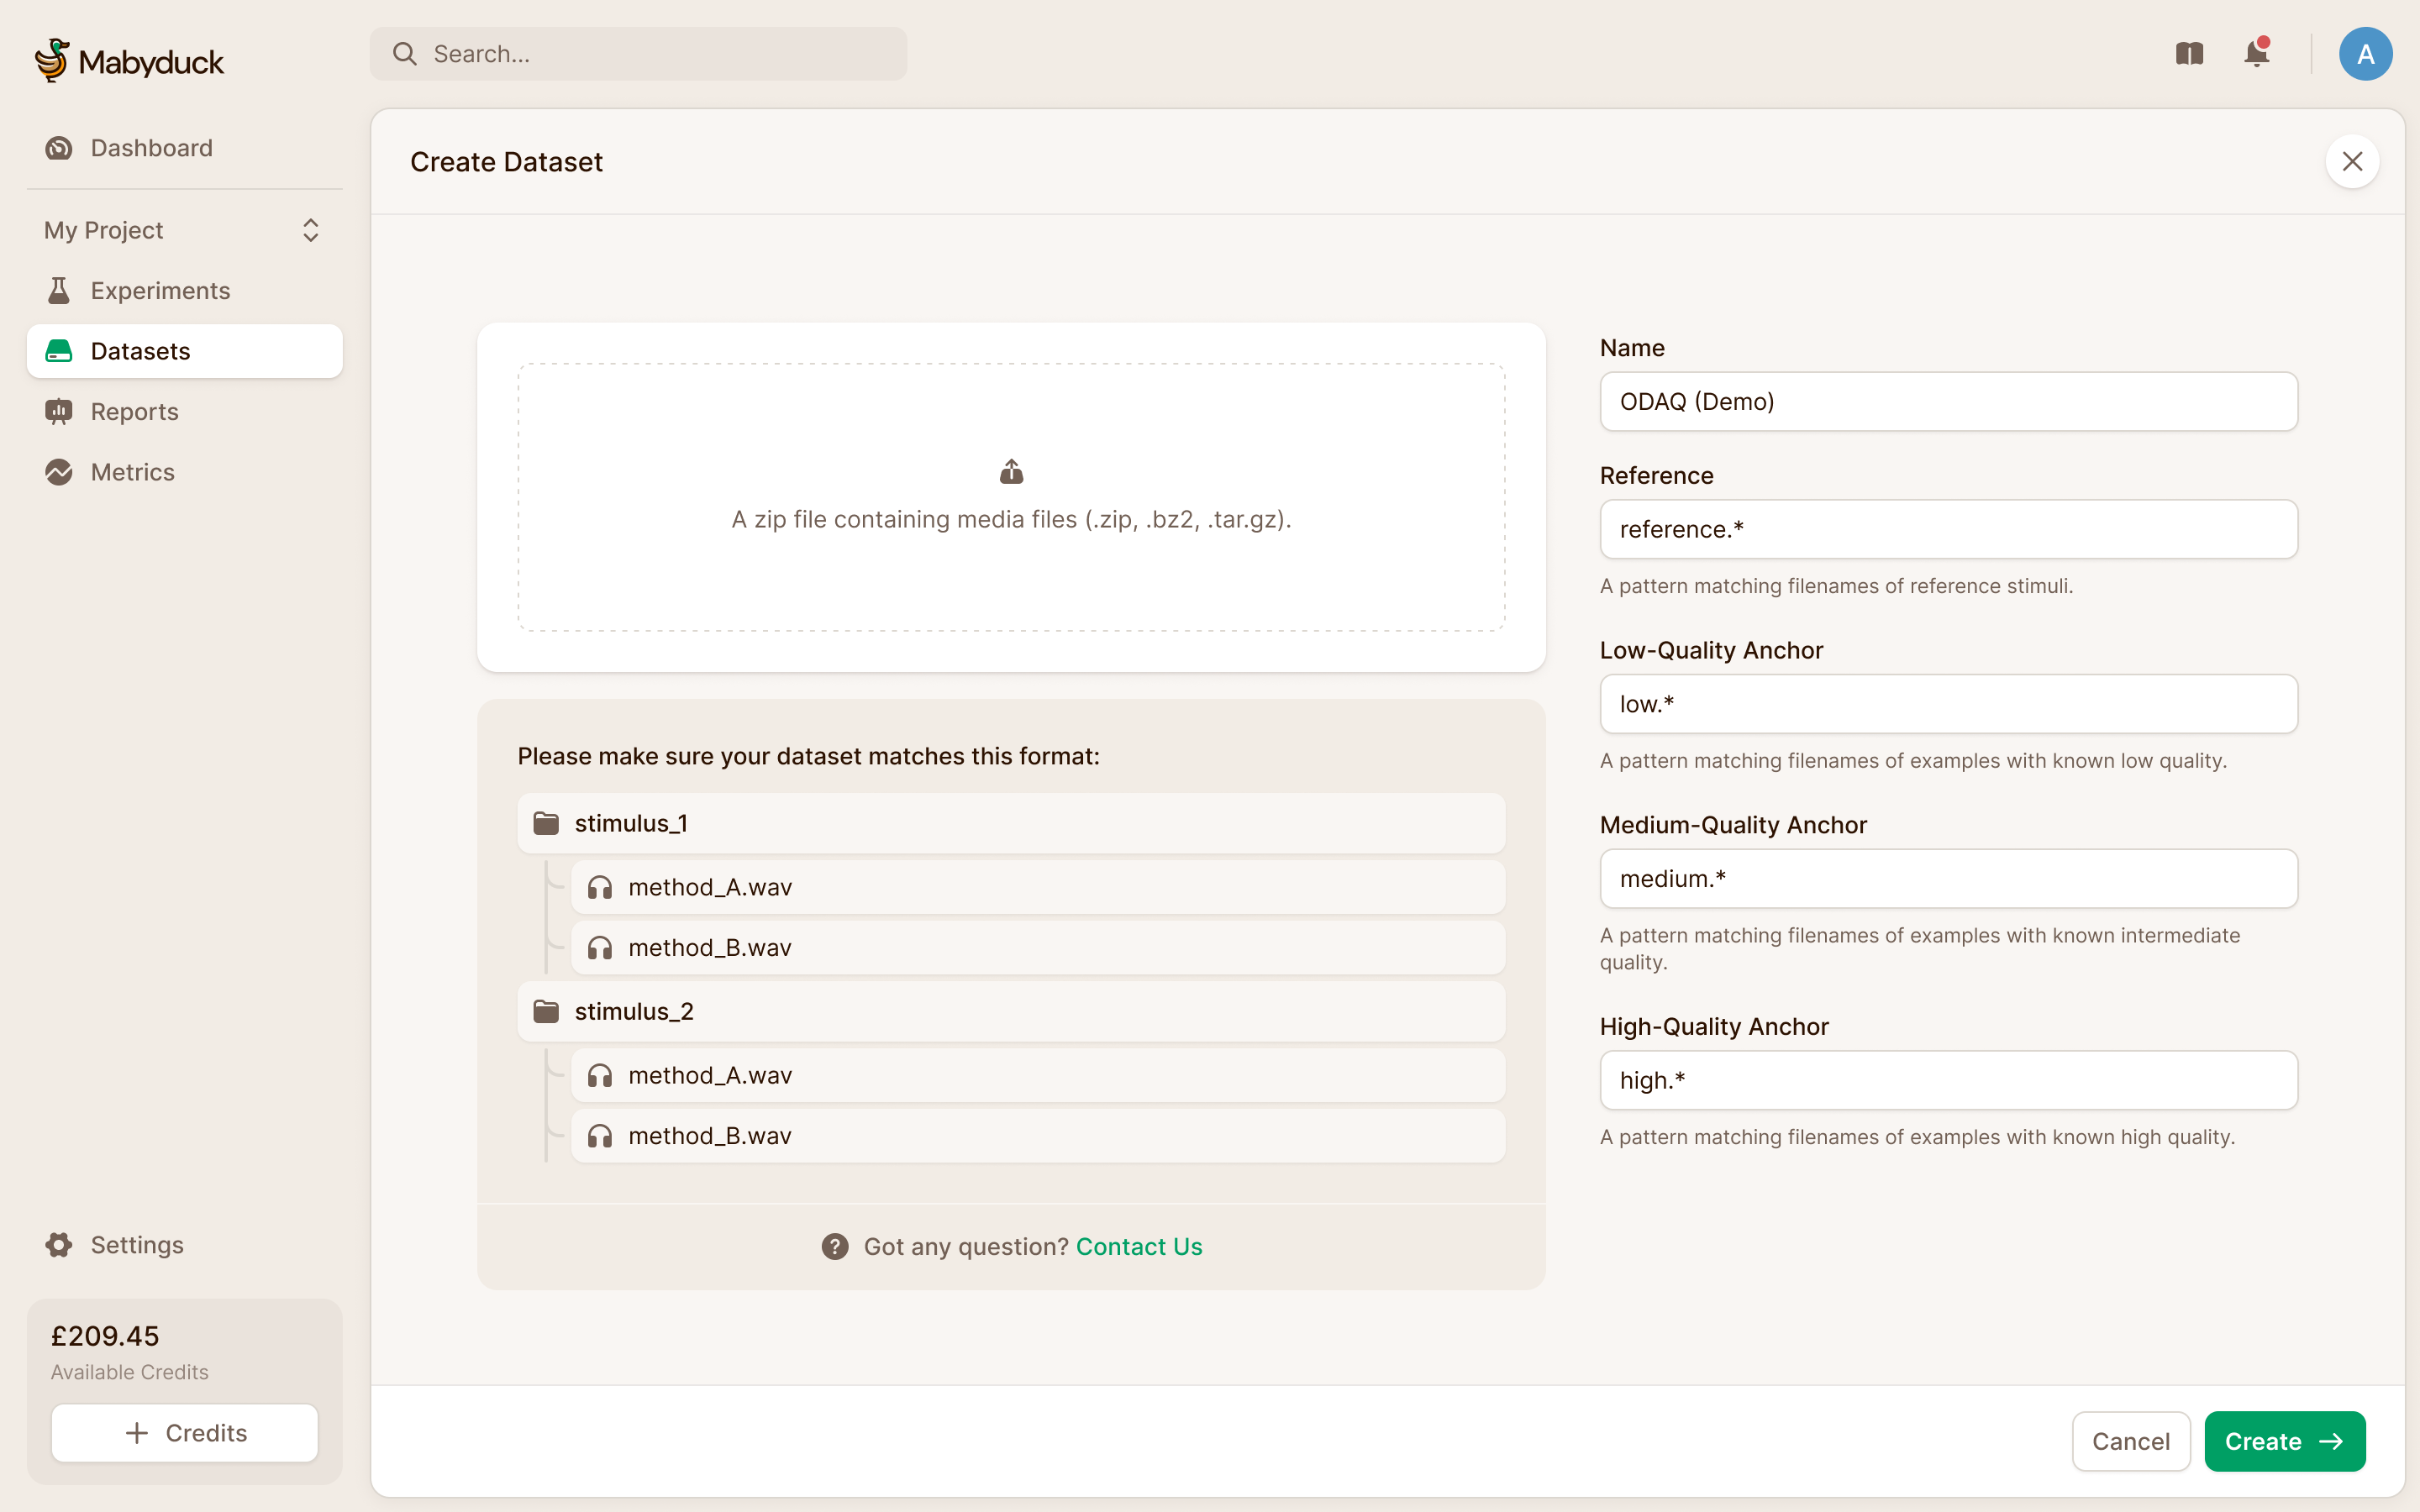
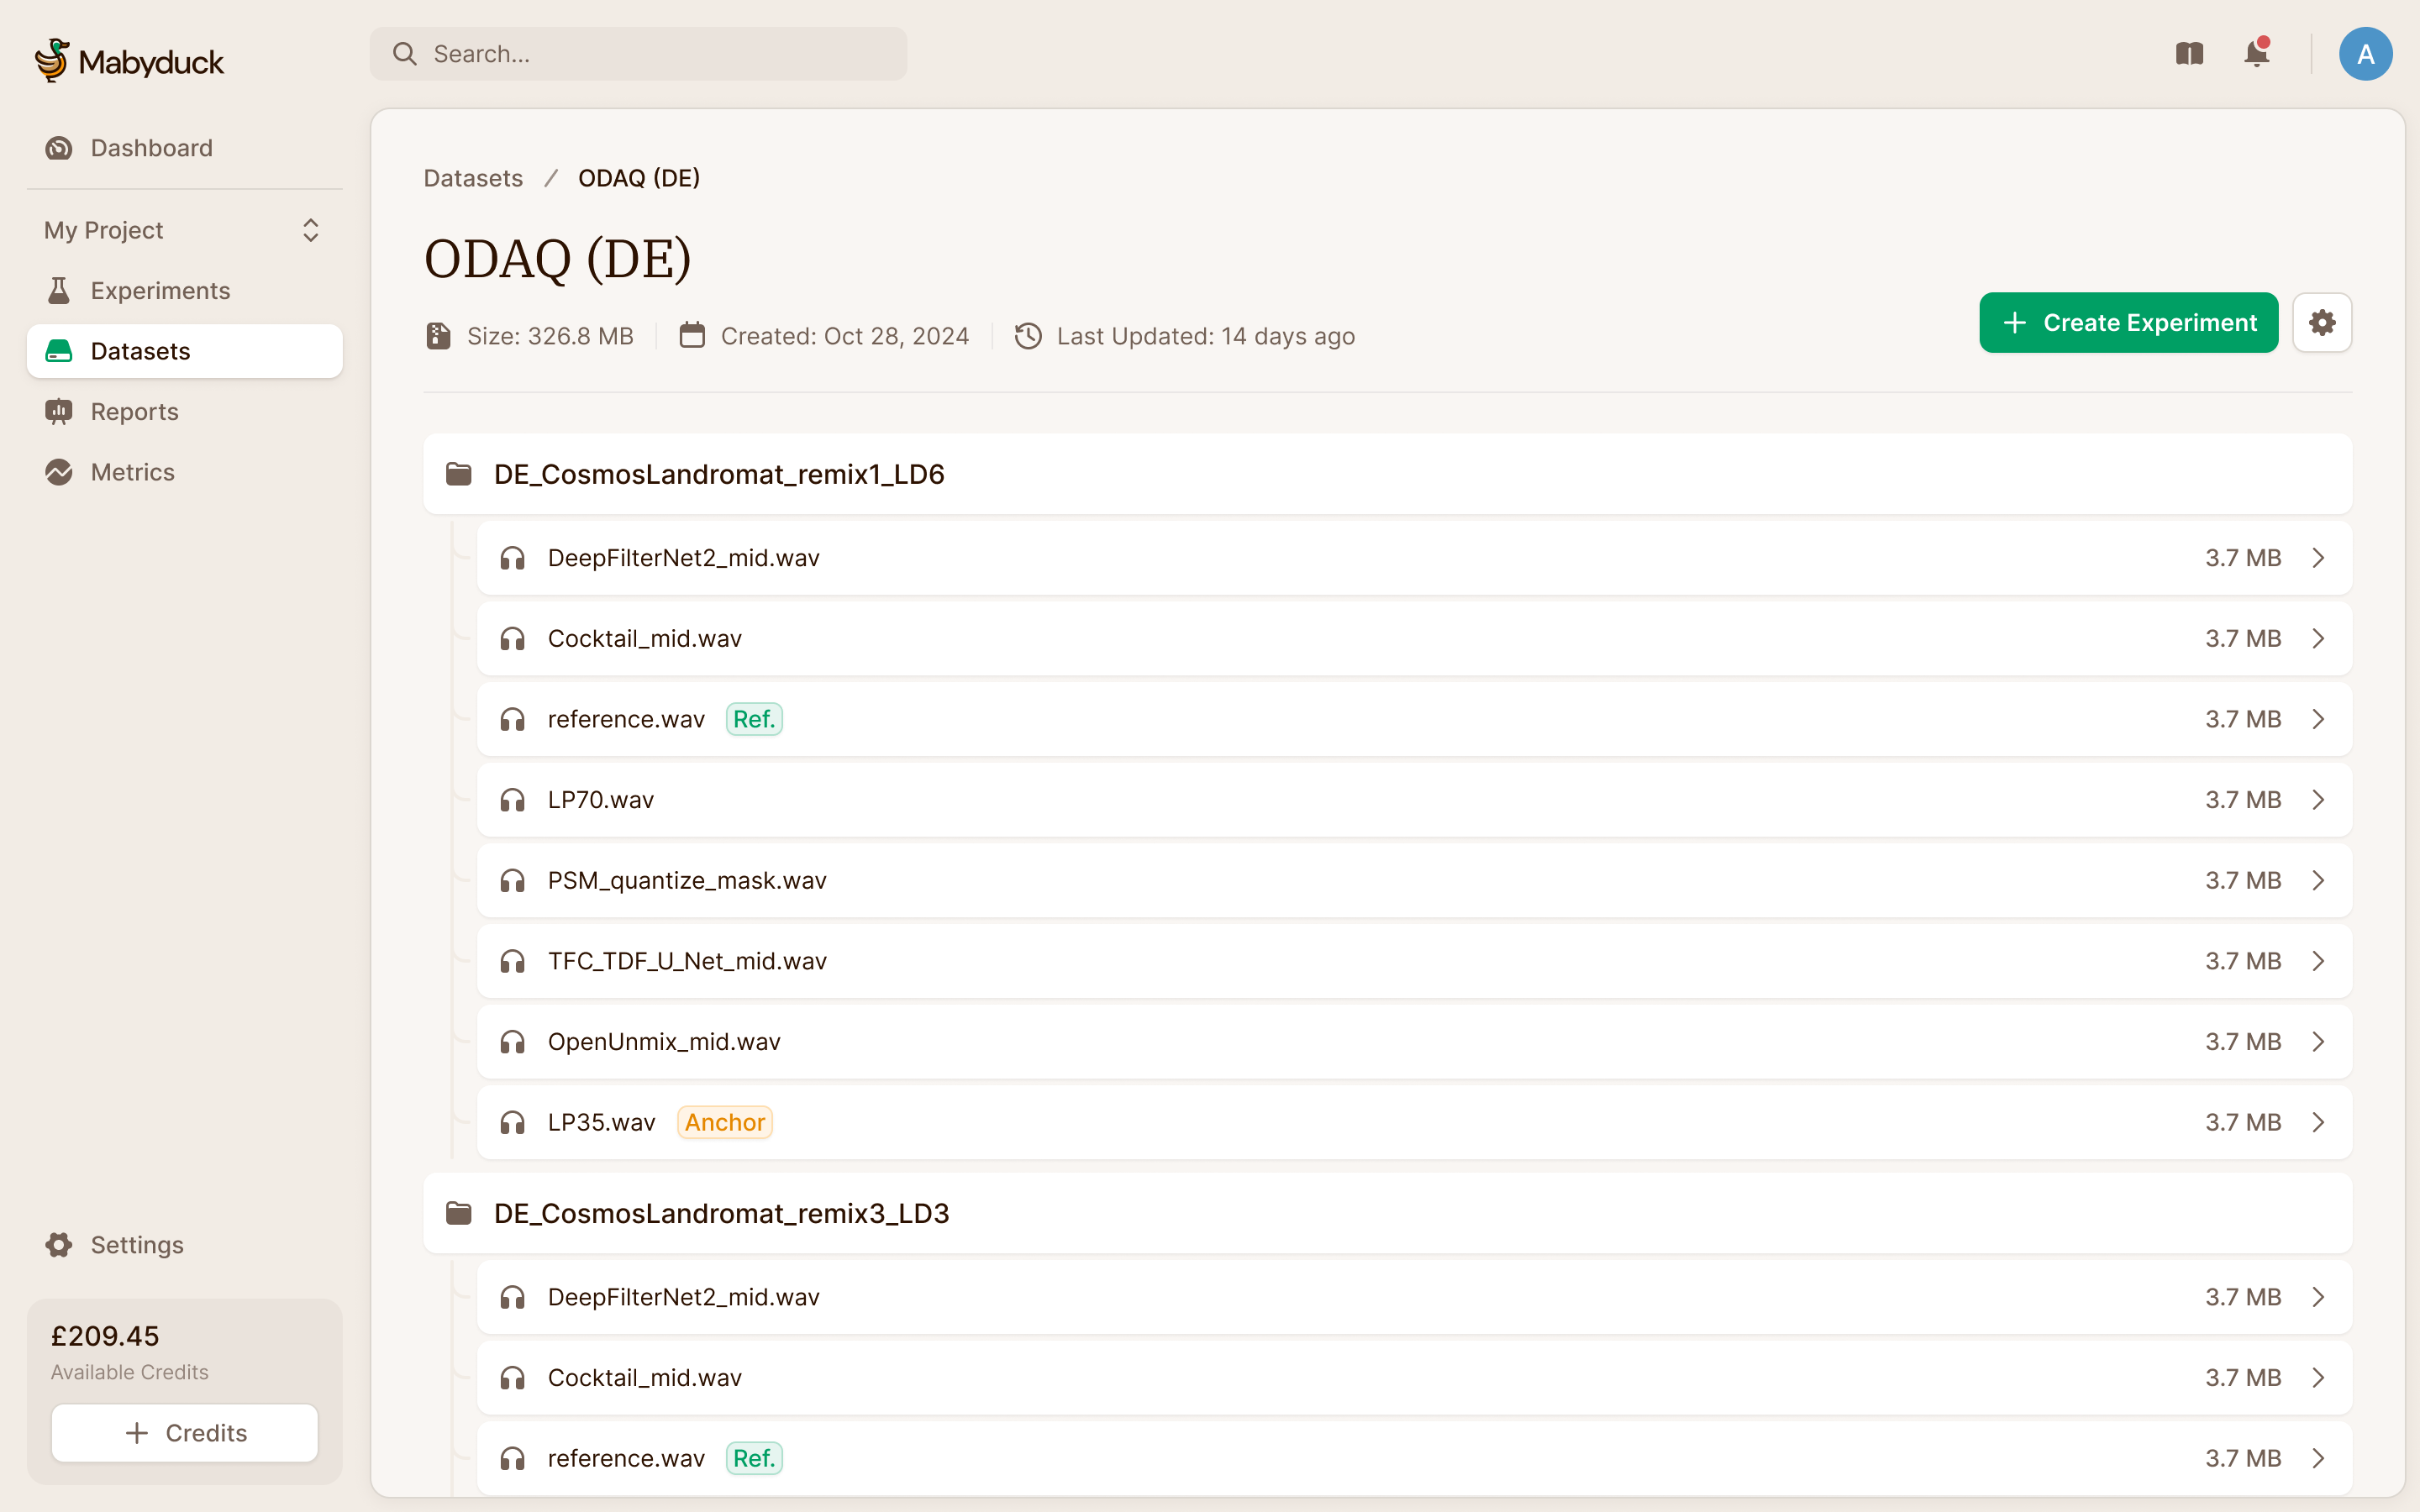
create the dataset where you need it, or reuse one you already have
The price is on screen the whole time
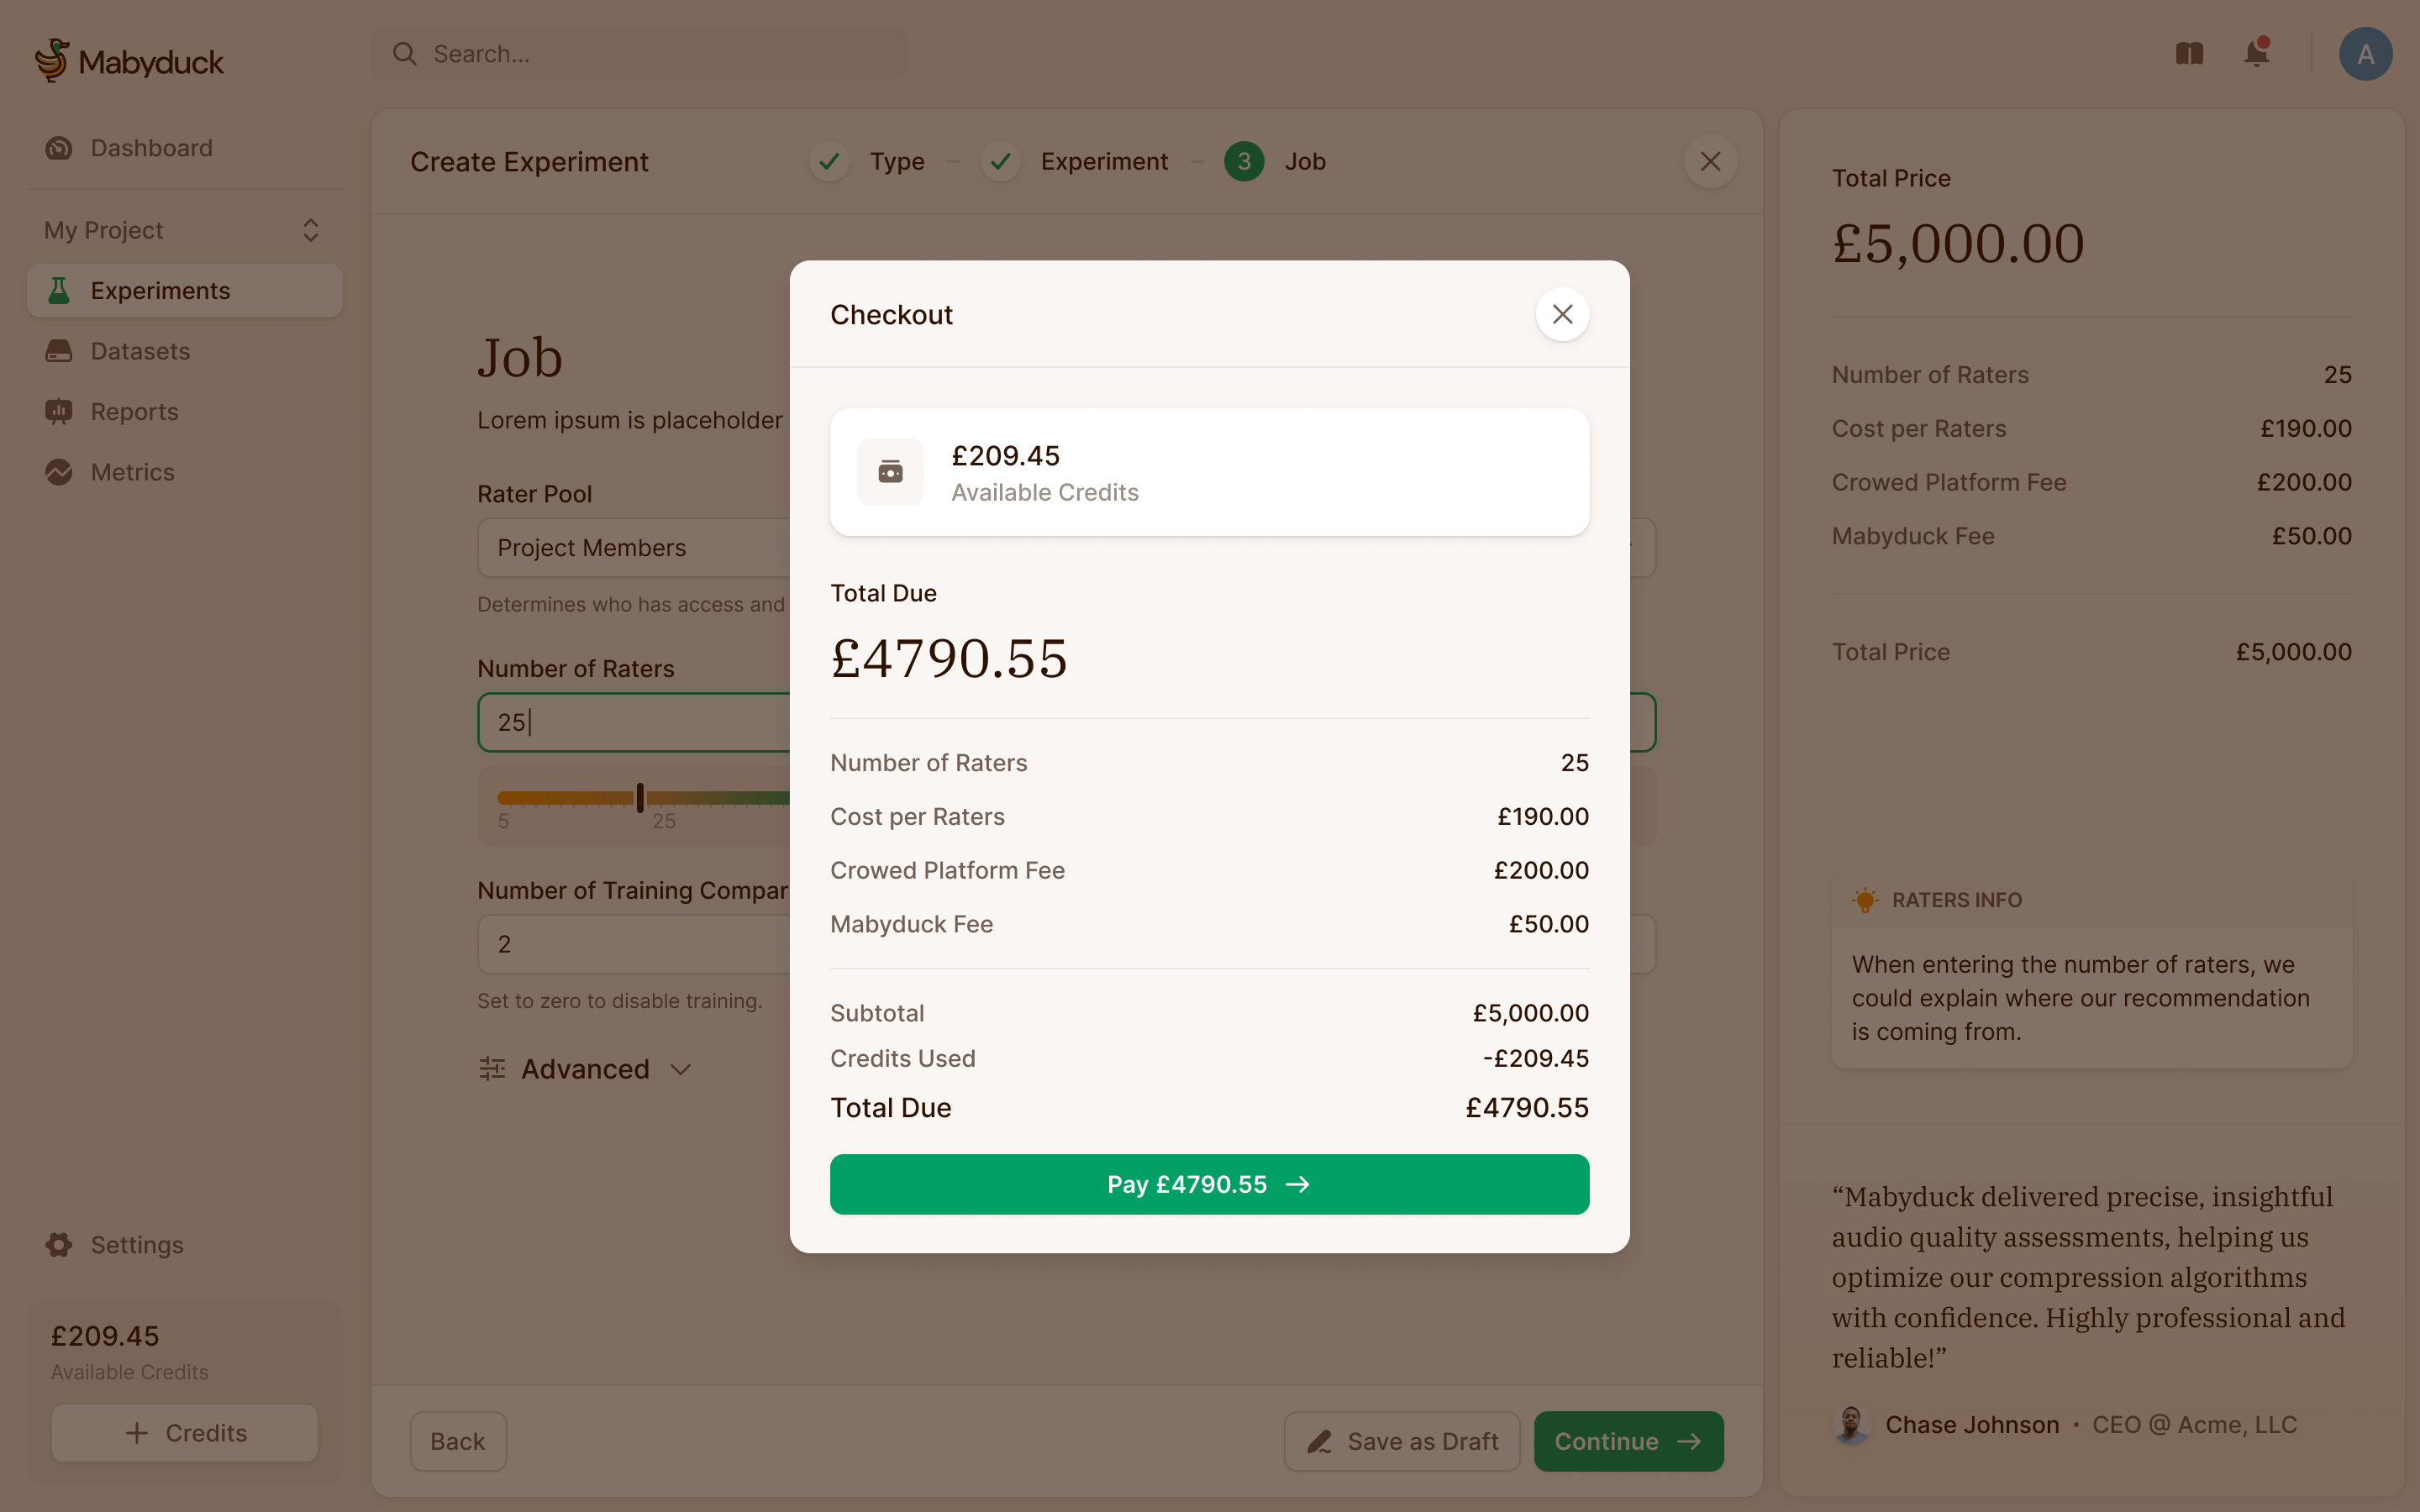
An experiment costs what it costs because of a few settings: how many raters, how many comparisons each, how many training rounds. We kept those settings in the open rather than bundling them into packages, and the price beside them updates as you change them. Everything else that's advanced is tucked away.
The rater count comes with a recommendation, shown here as a marked band of 20 to 25. We put that guidance beside the input rather than making people leave the form to understand what a reasonable choice looks like. They can still choose a different number.
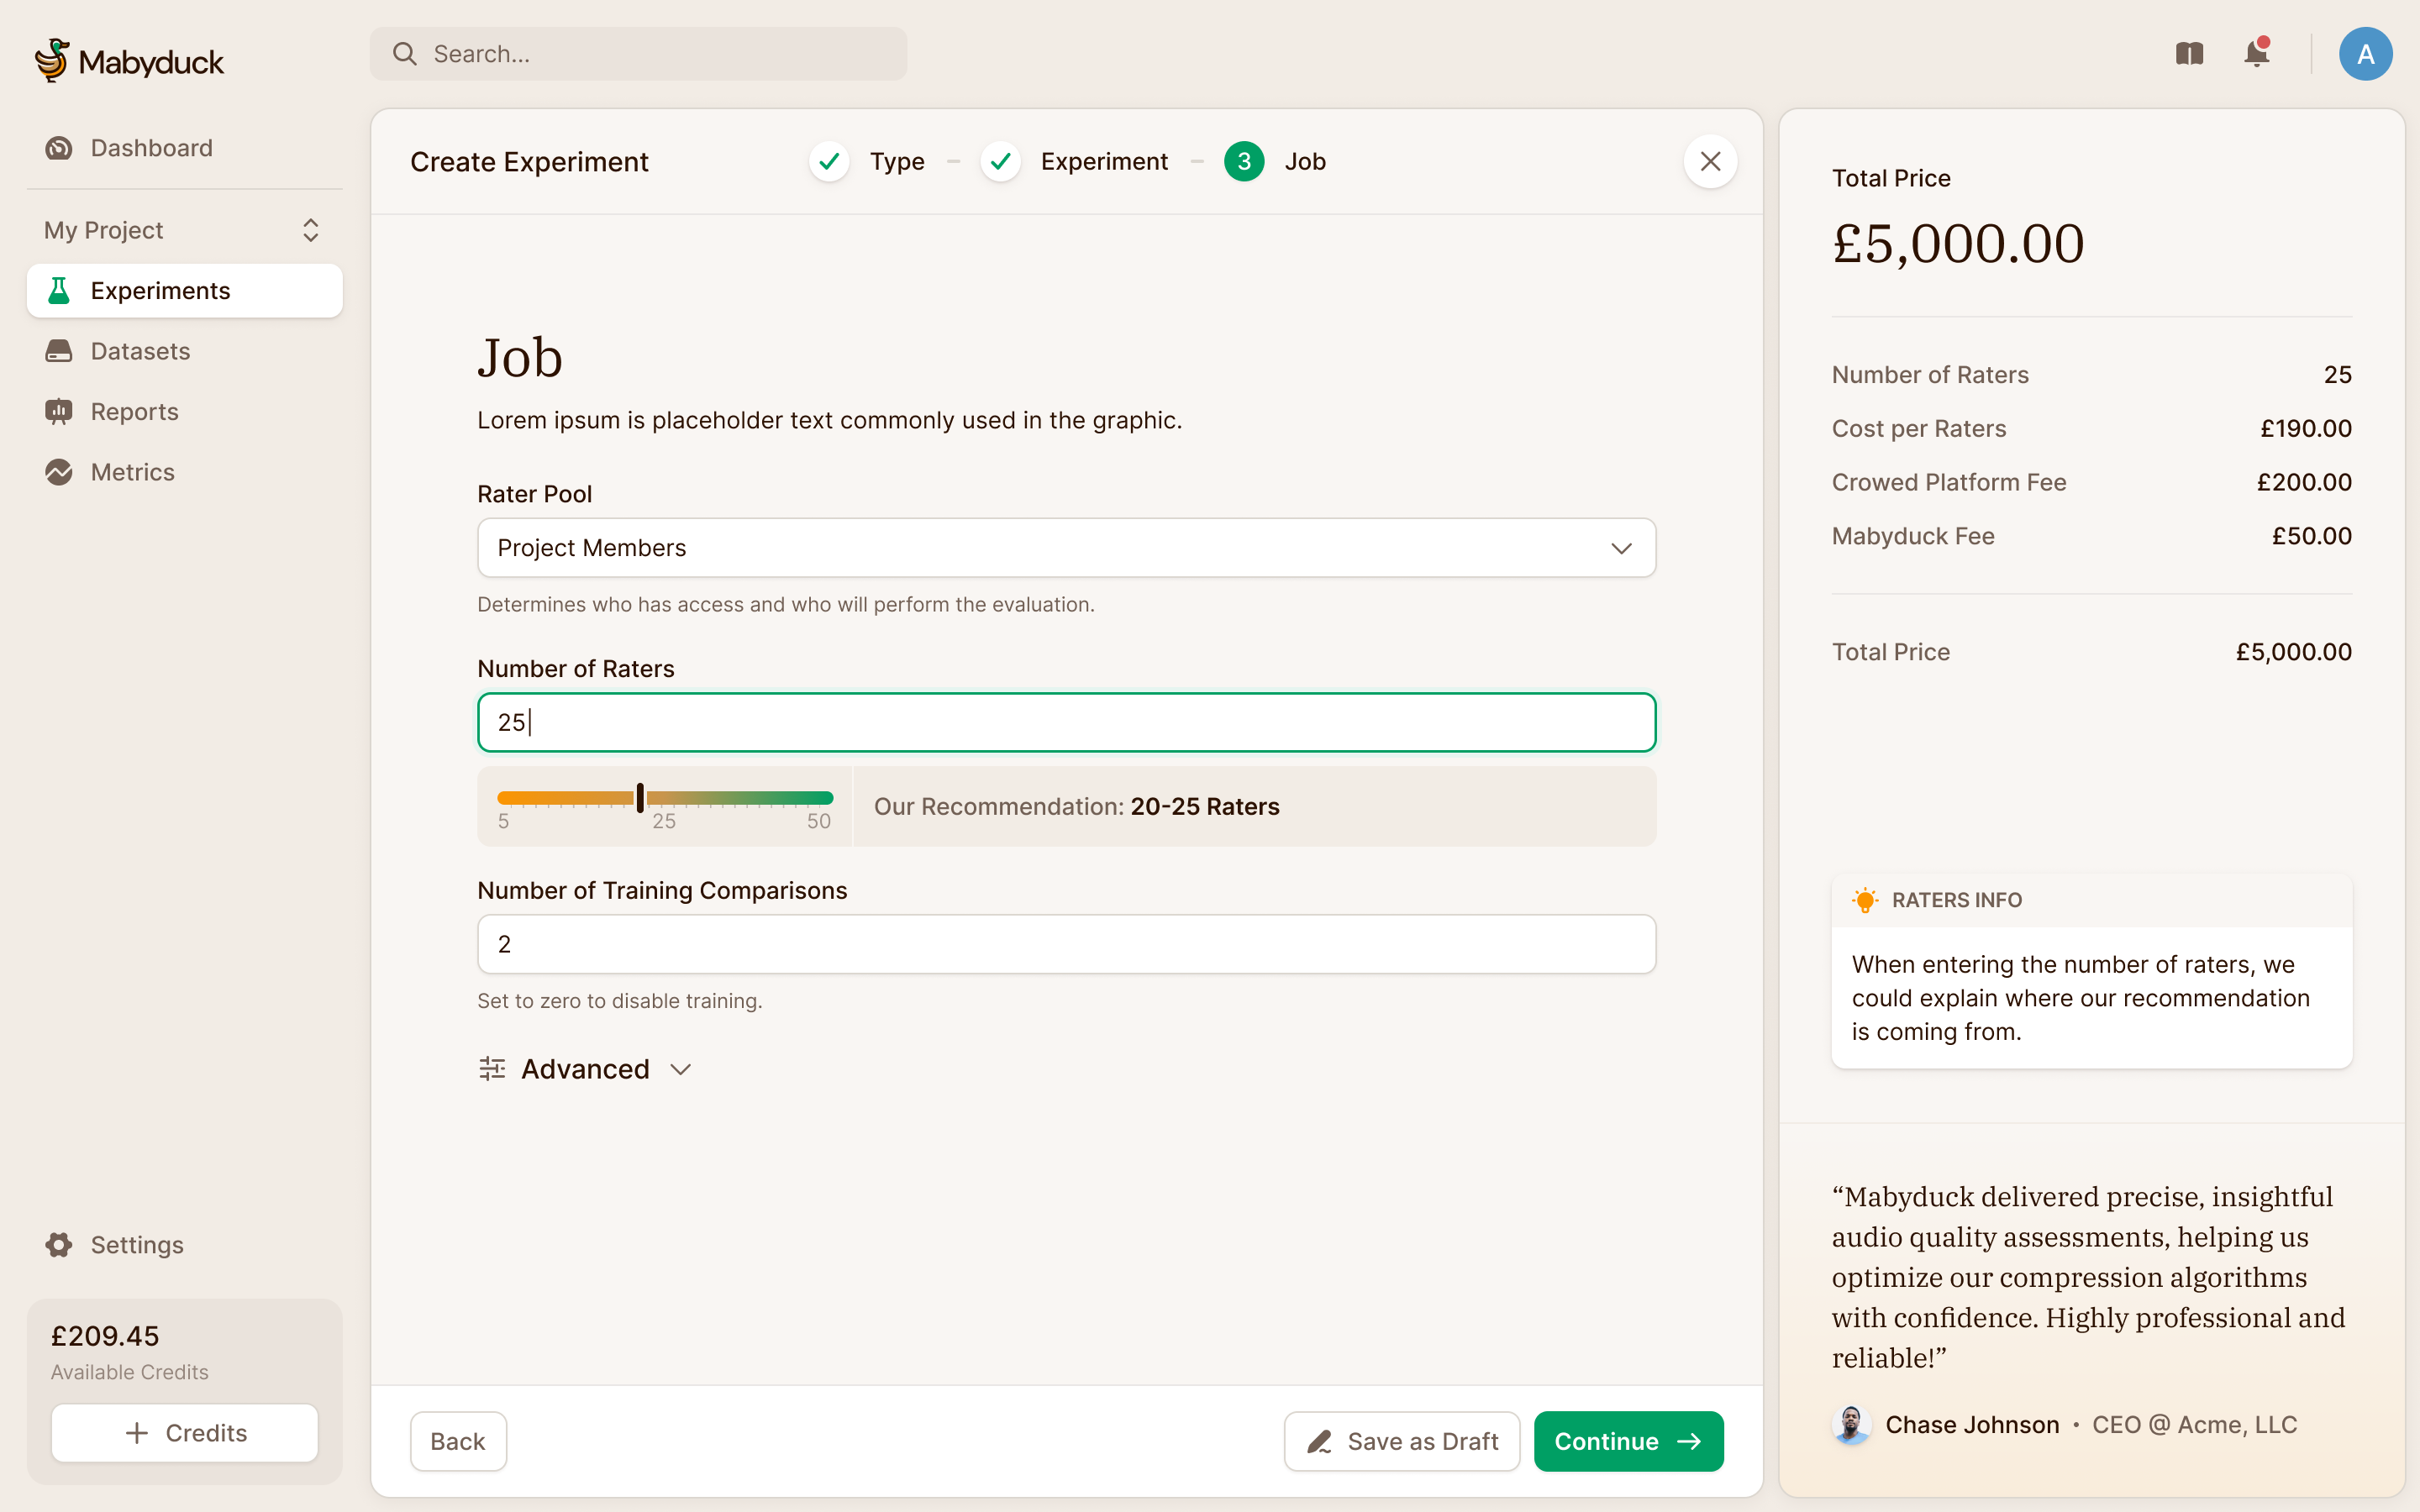
The first version put that total in a bar along the bottom of the screen, which felt claustrophobic. It moved into a side panel, and checkout follows Prolific's model, so researchers who've paid for a crowd study before already know where everything is.
Experiments hold jobs, and the jobs are the work
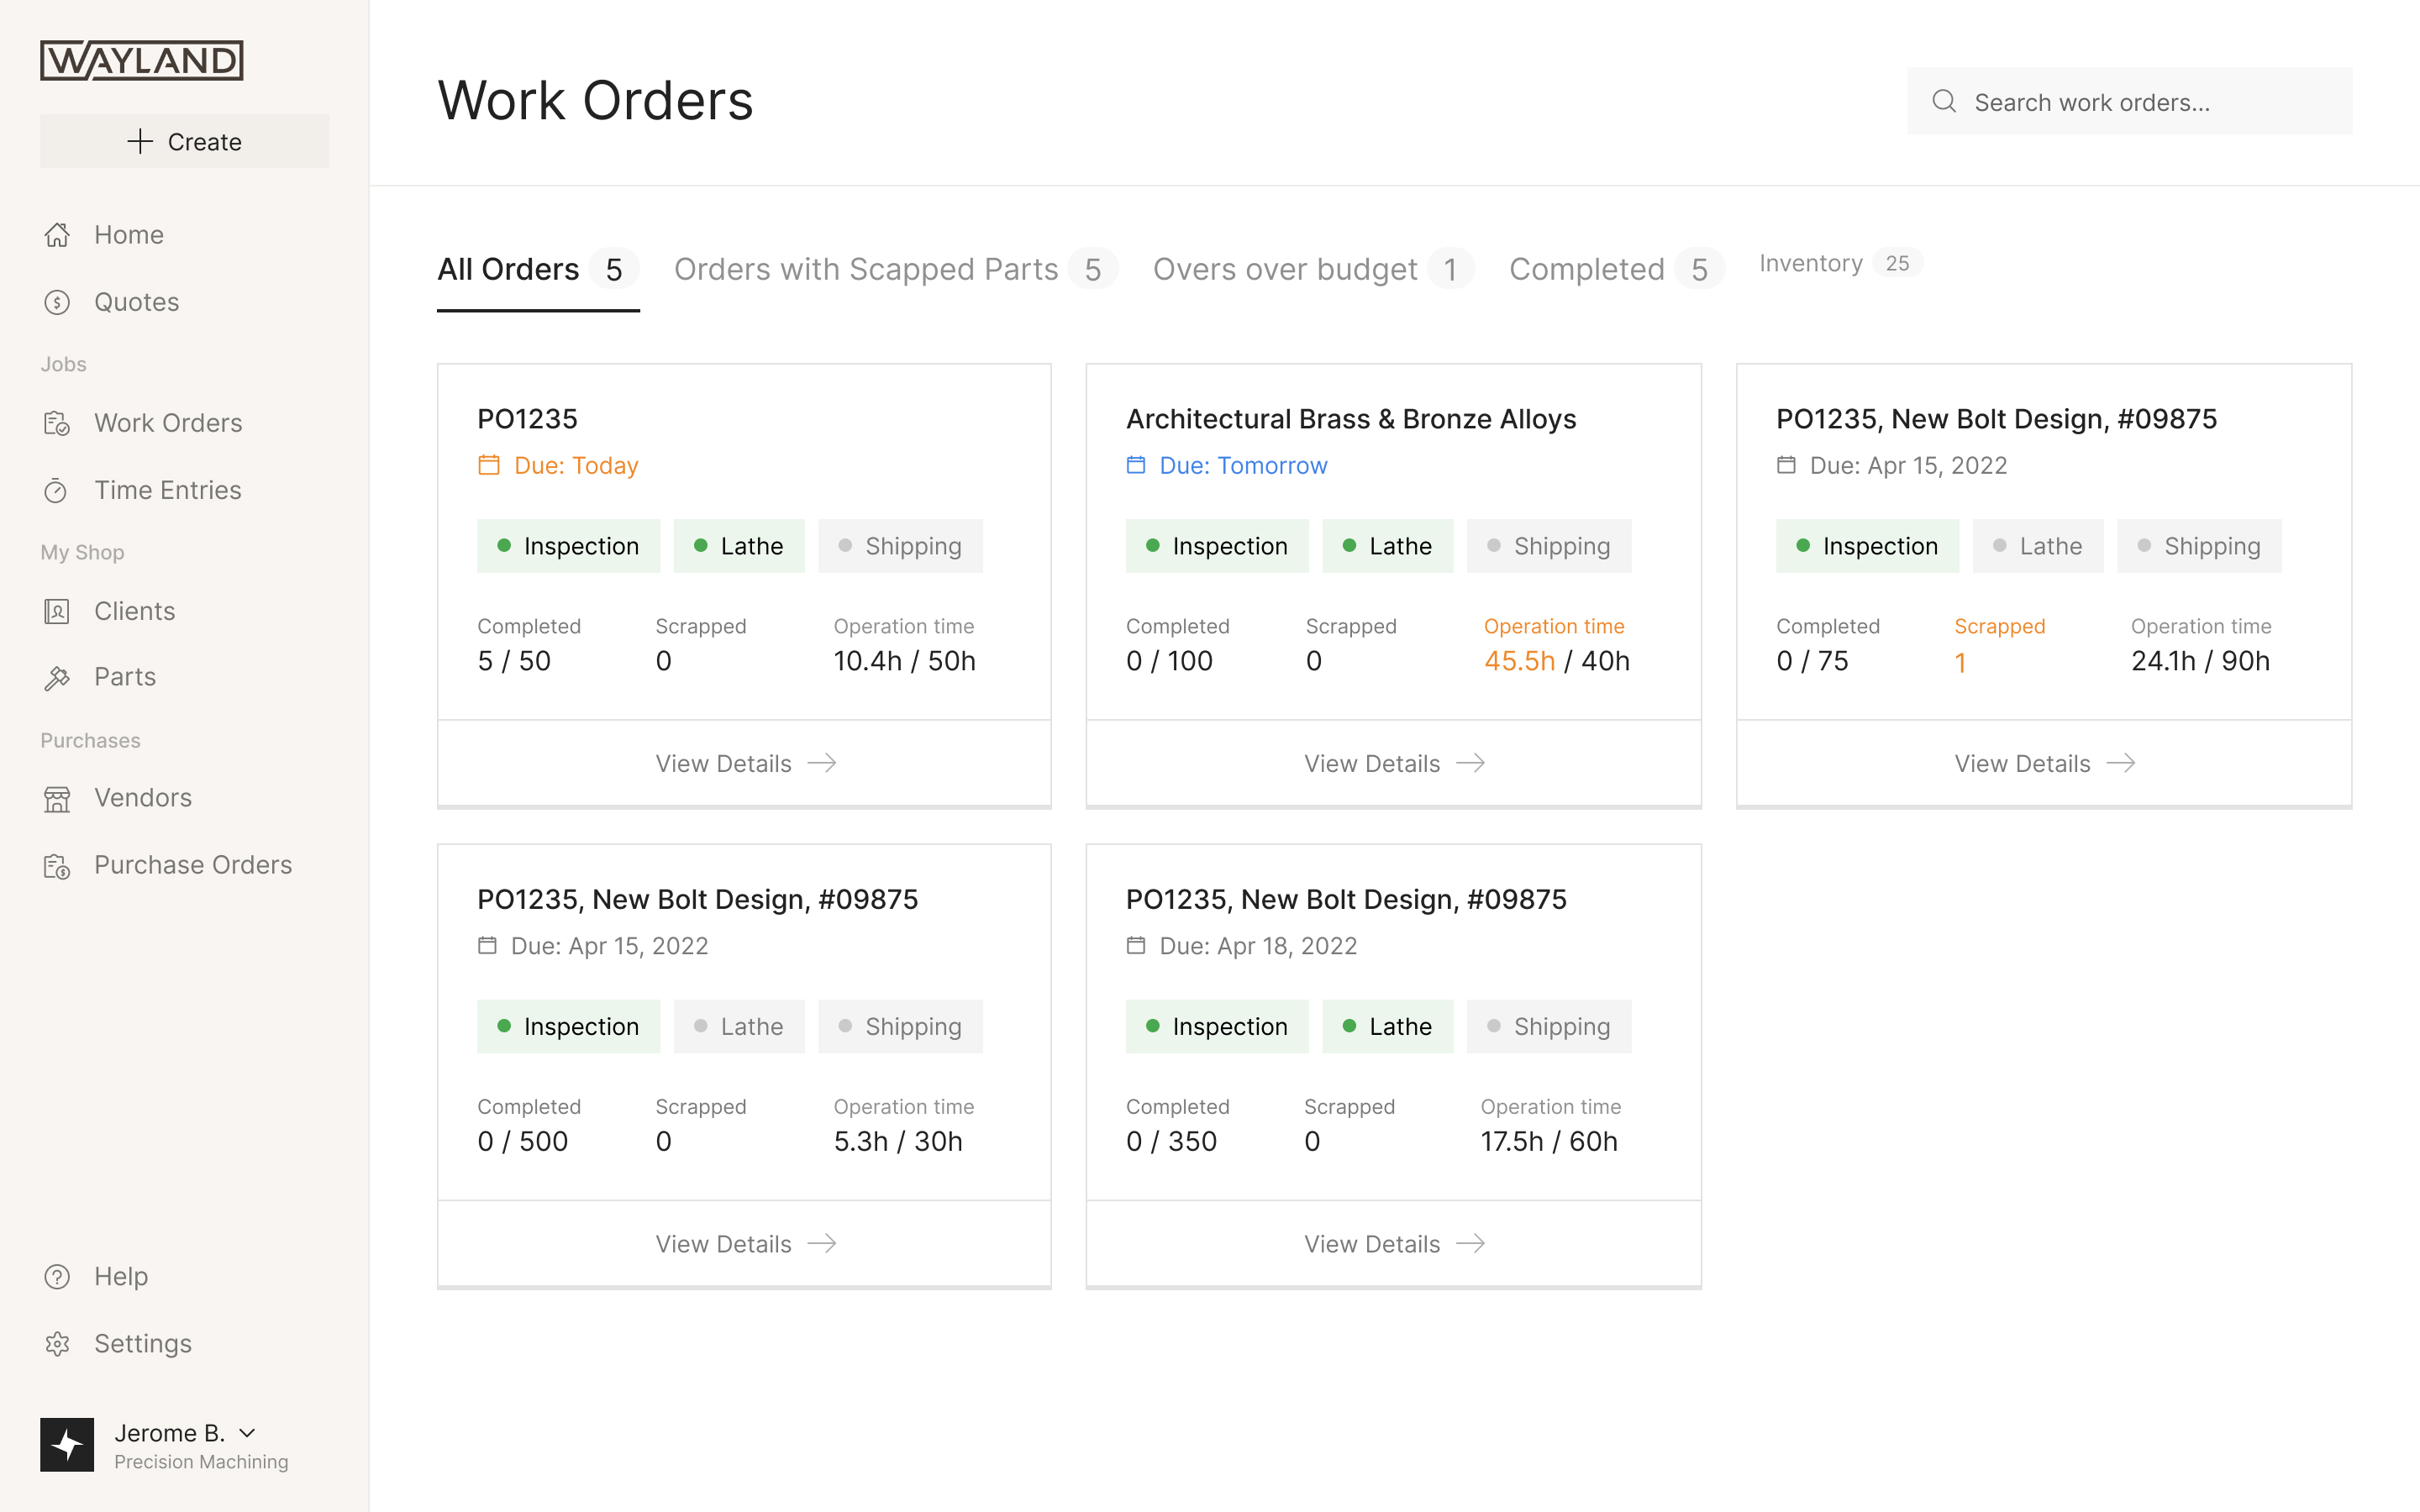
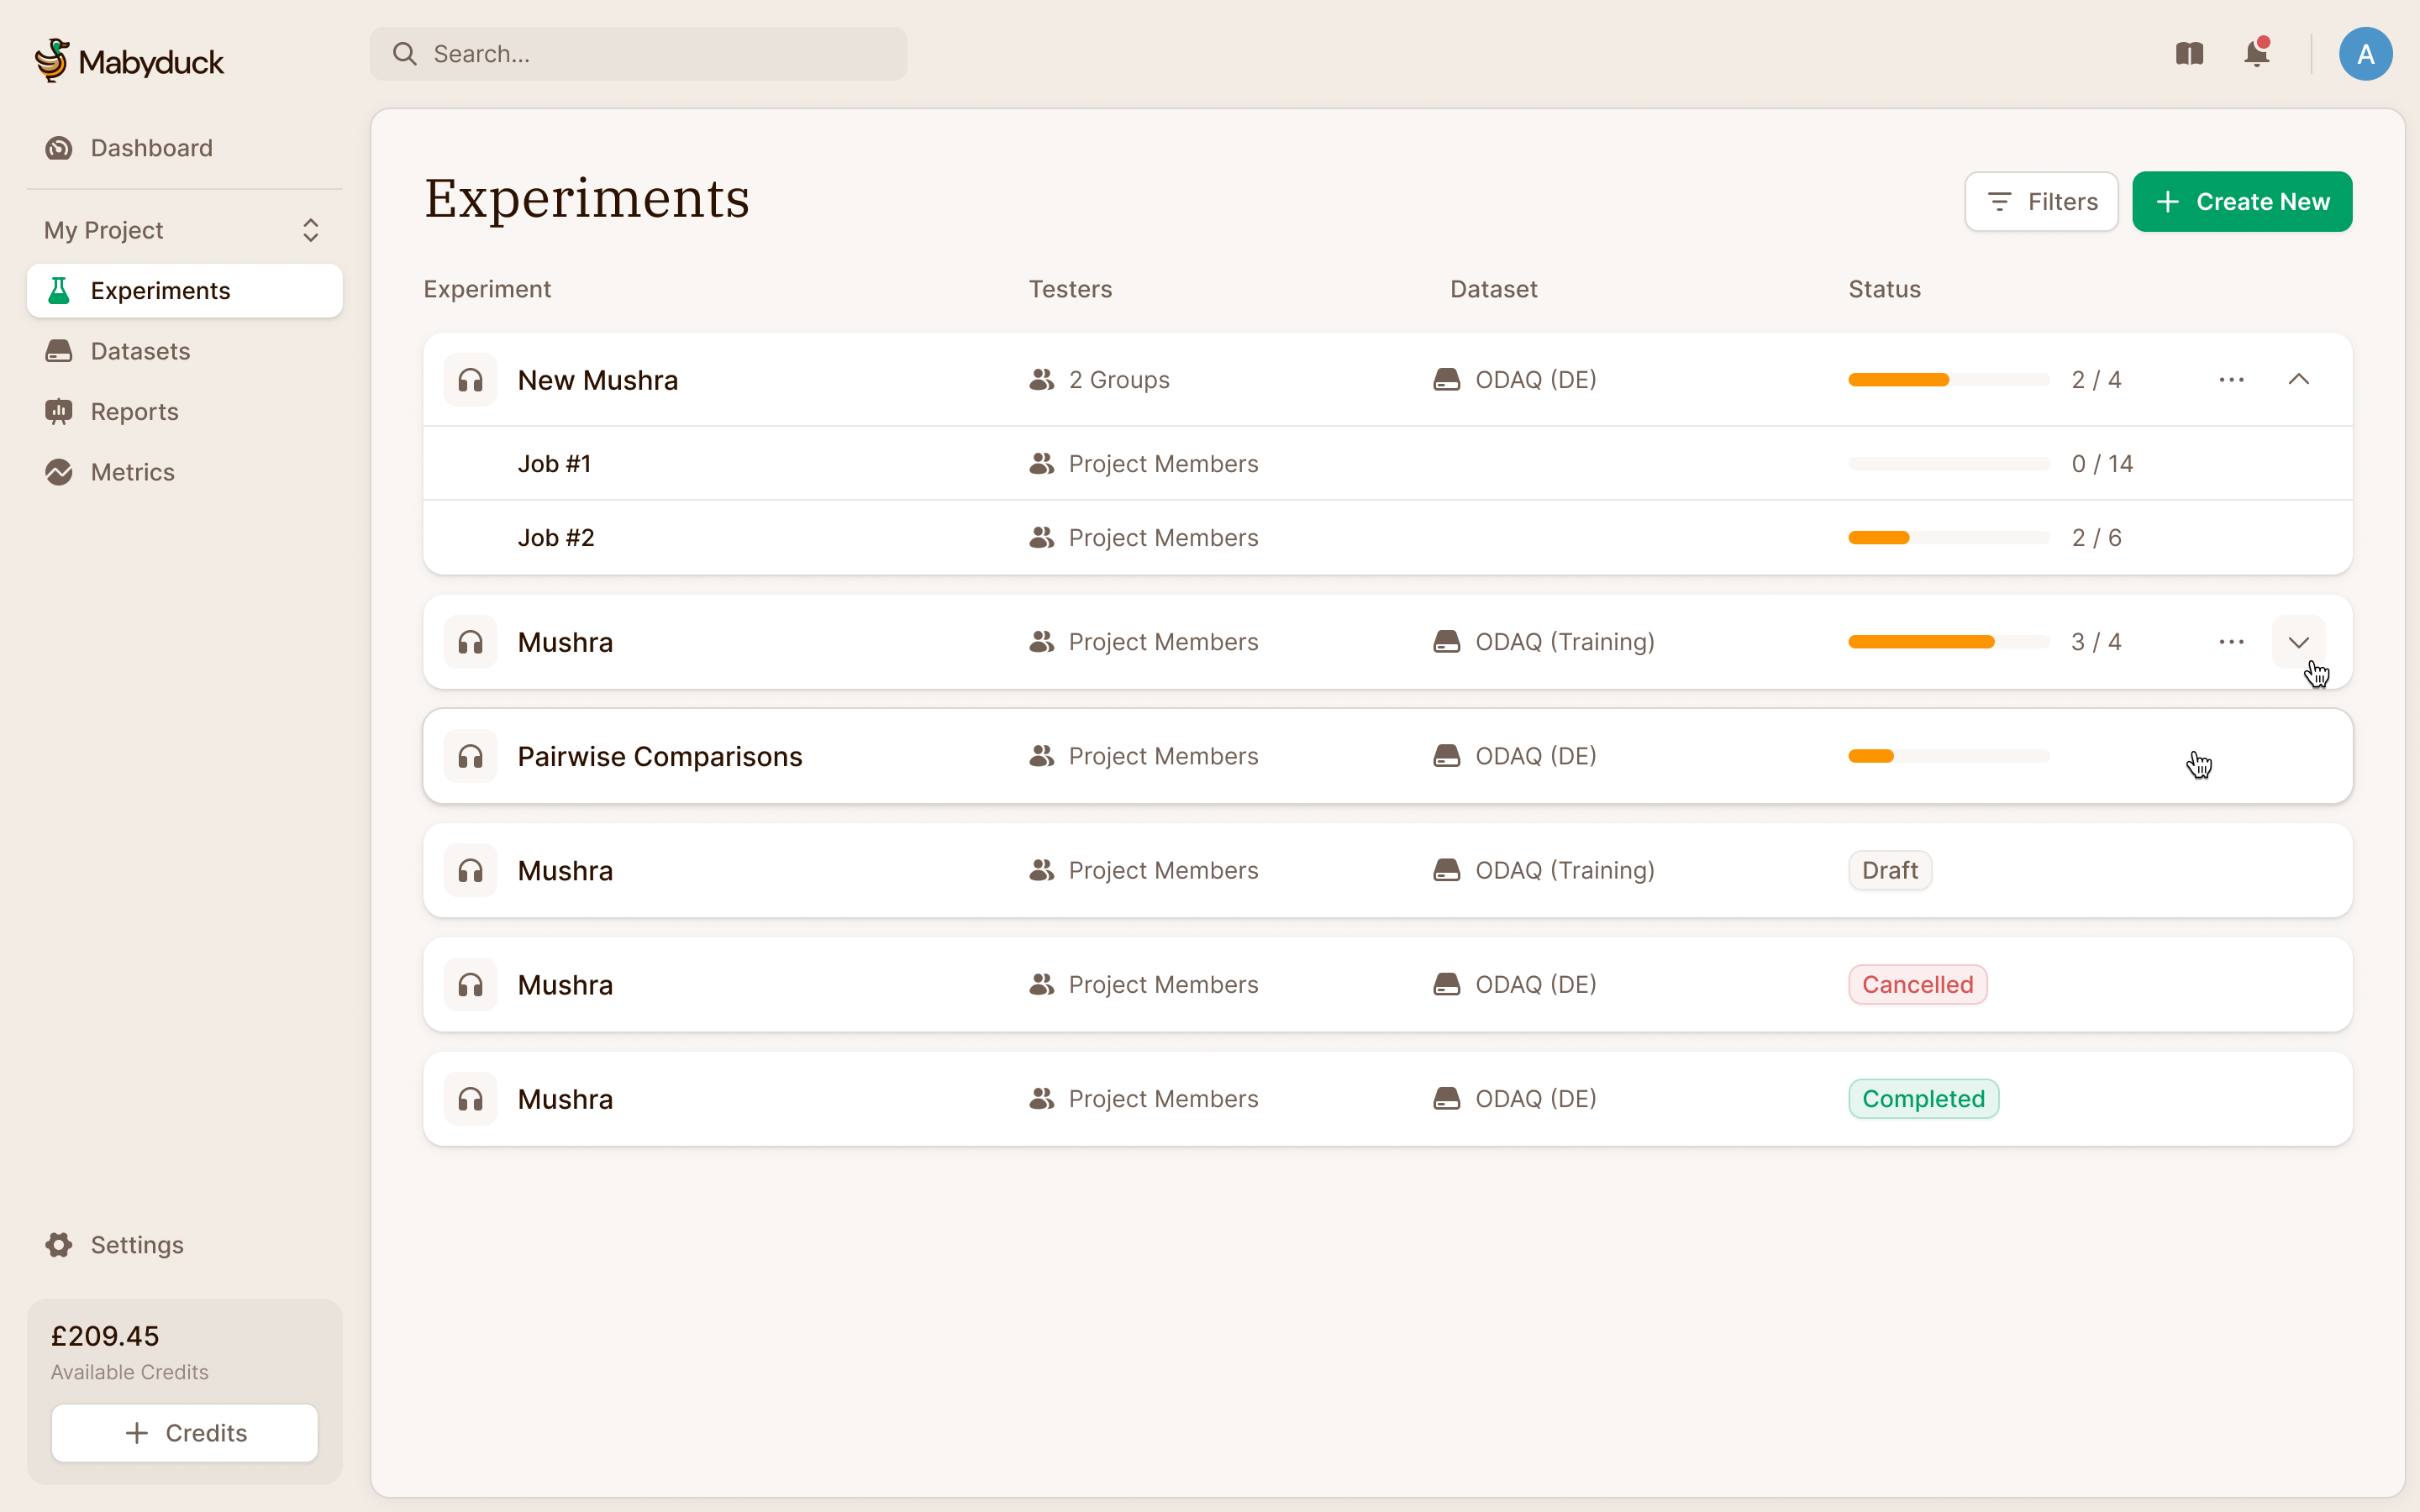
An experiment can run several jobs at once, one per rater pool, each in a different state. Sort a flat table of all of them and a job still running can end up buried. So jobs nest under their experiment in collapsible rows, collapsed by default, with progress rolled up to the experiment. Inside the experiment, the job view keeps the selected pool, progress and parameters together. A researcher can inspect a completed job without confusing its state with another job that is still collecting responses.
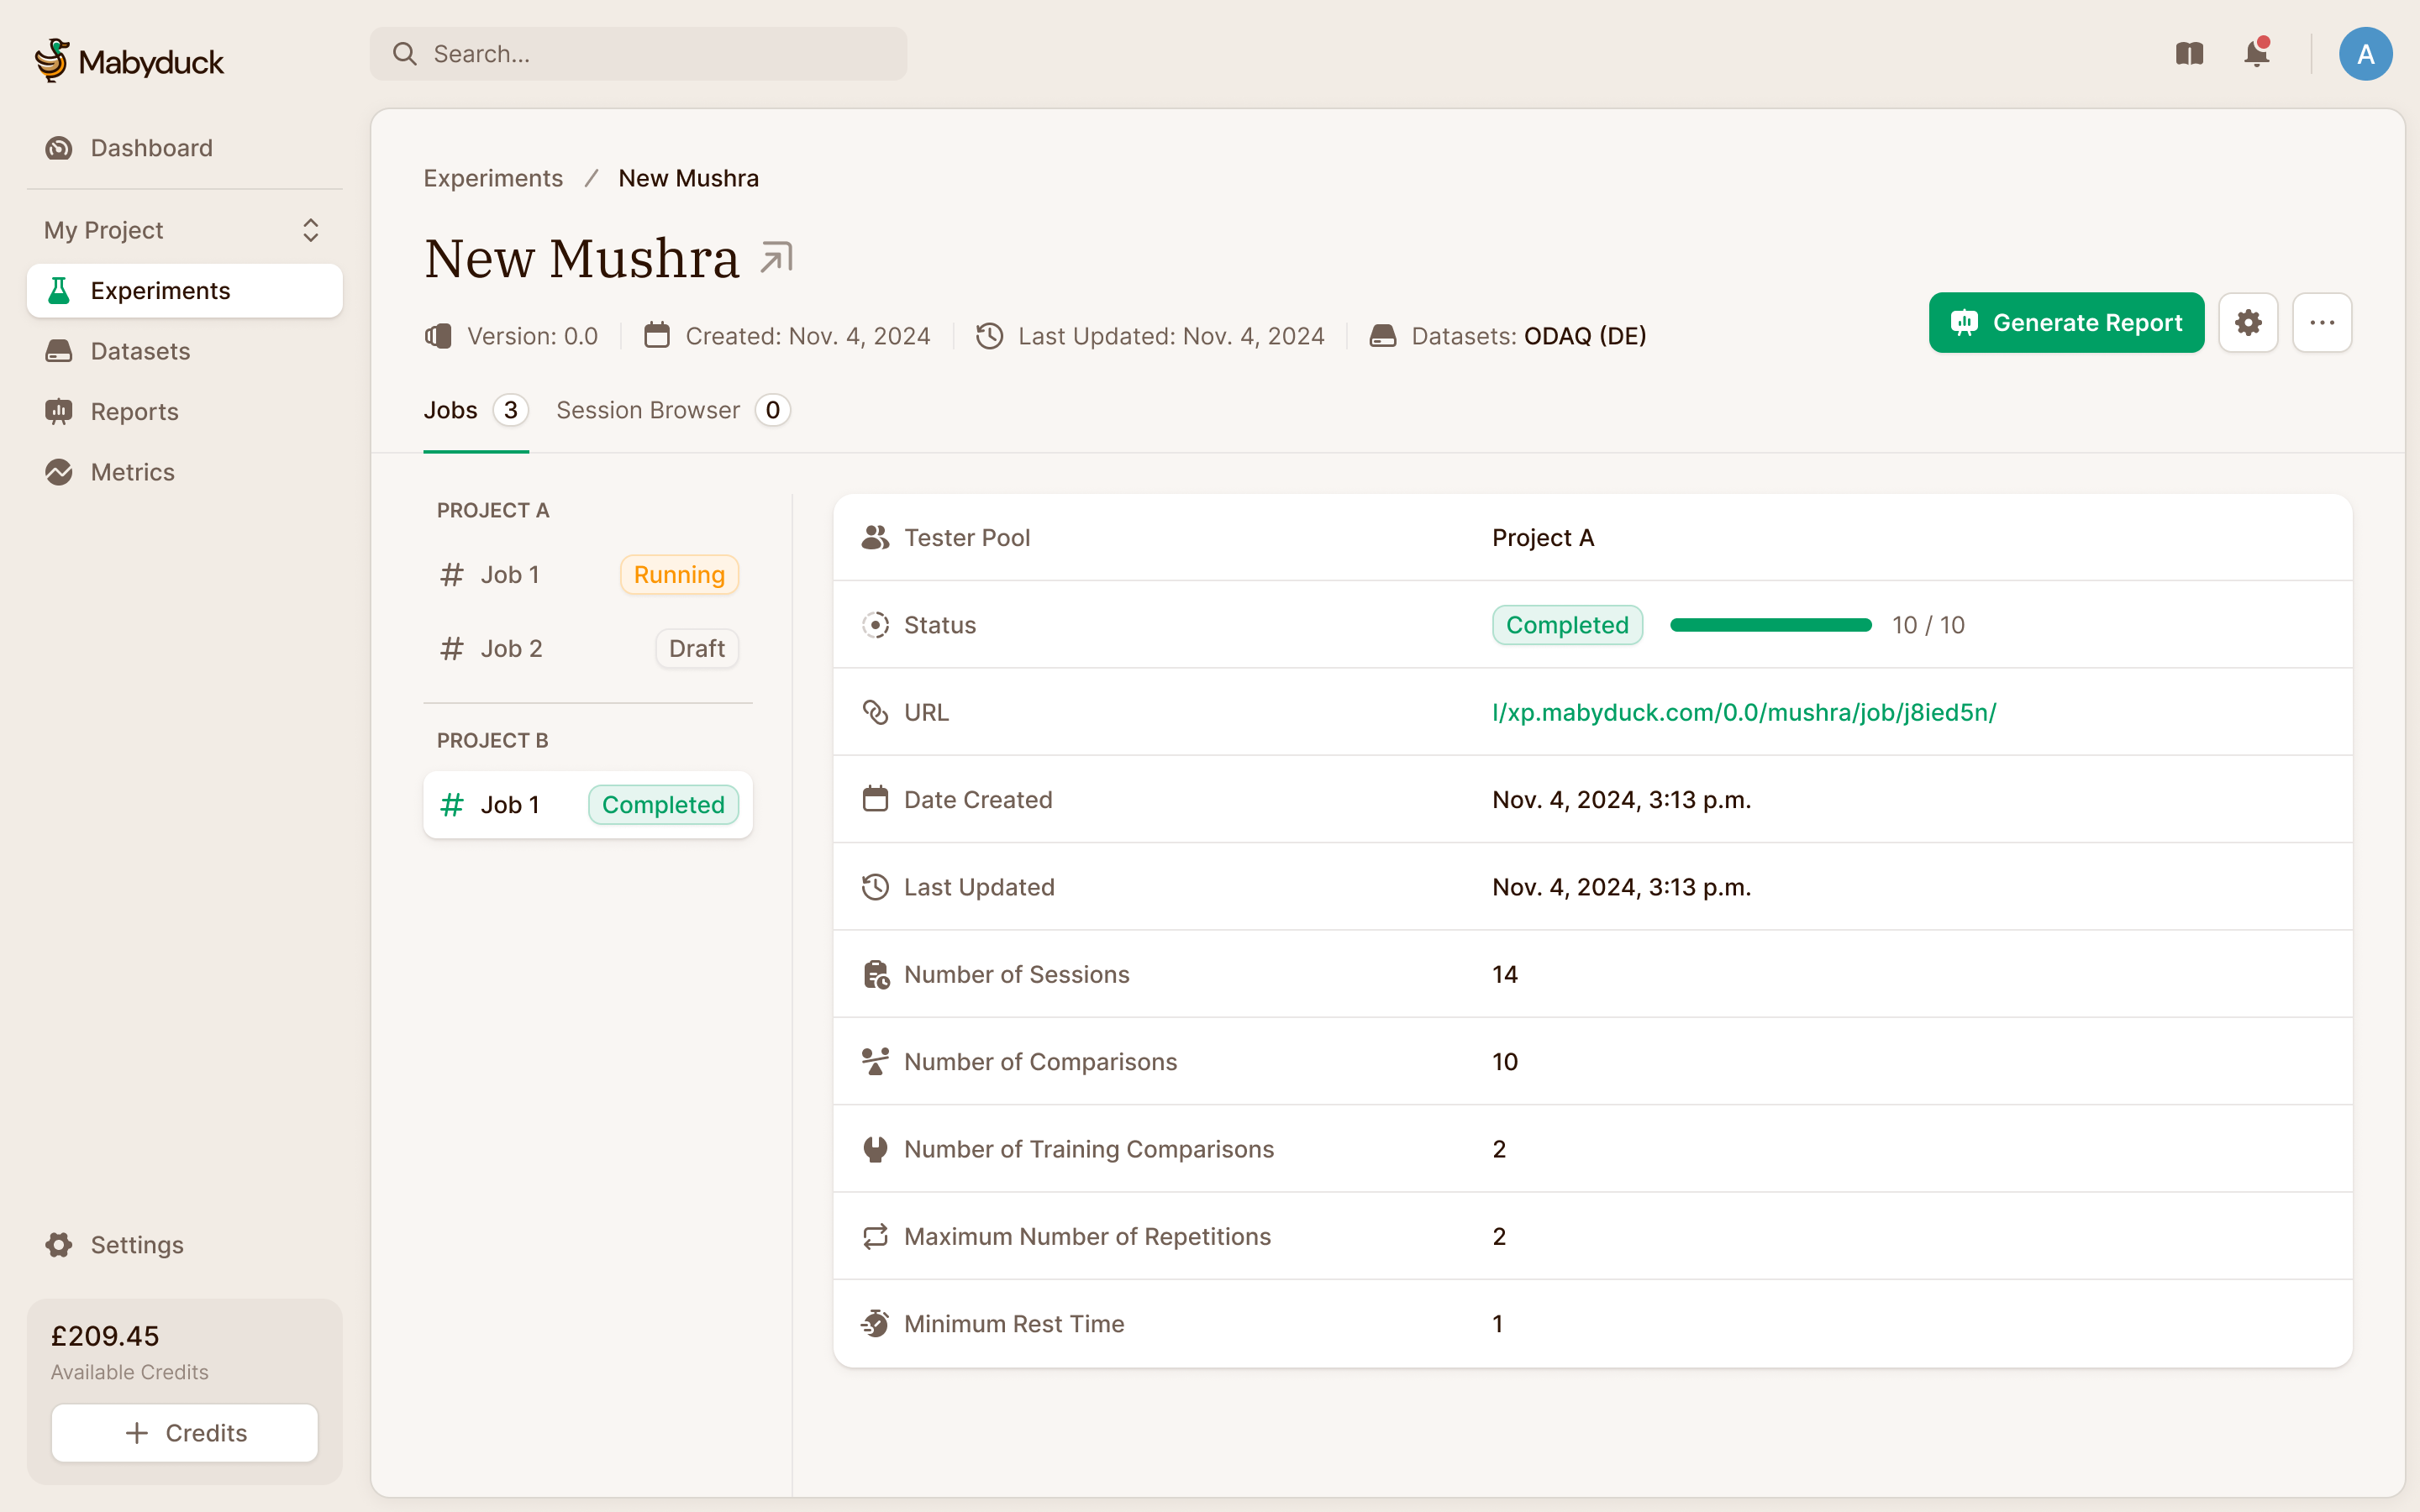
We also designed a dashboard, and then parked it. Most customers had one project, so the numbers a dashboard would have shown went at the top of the experiments list instead.
One report can combine several experiments
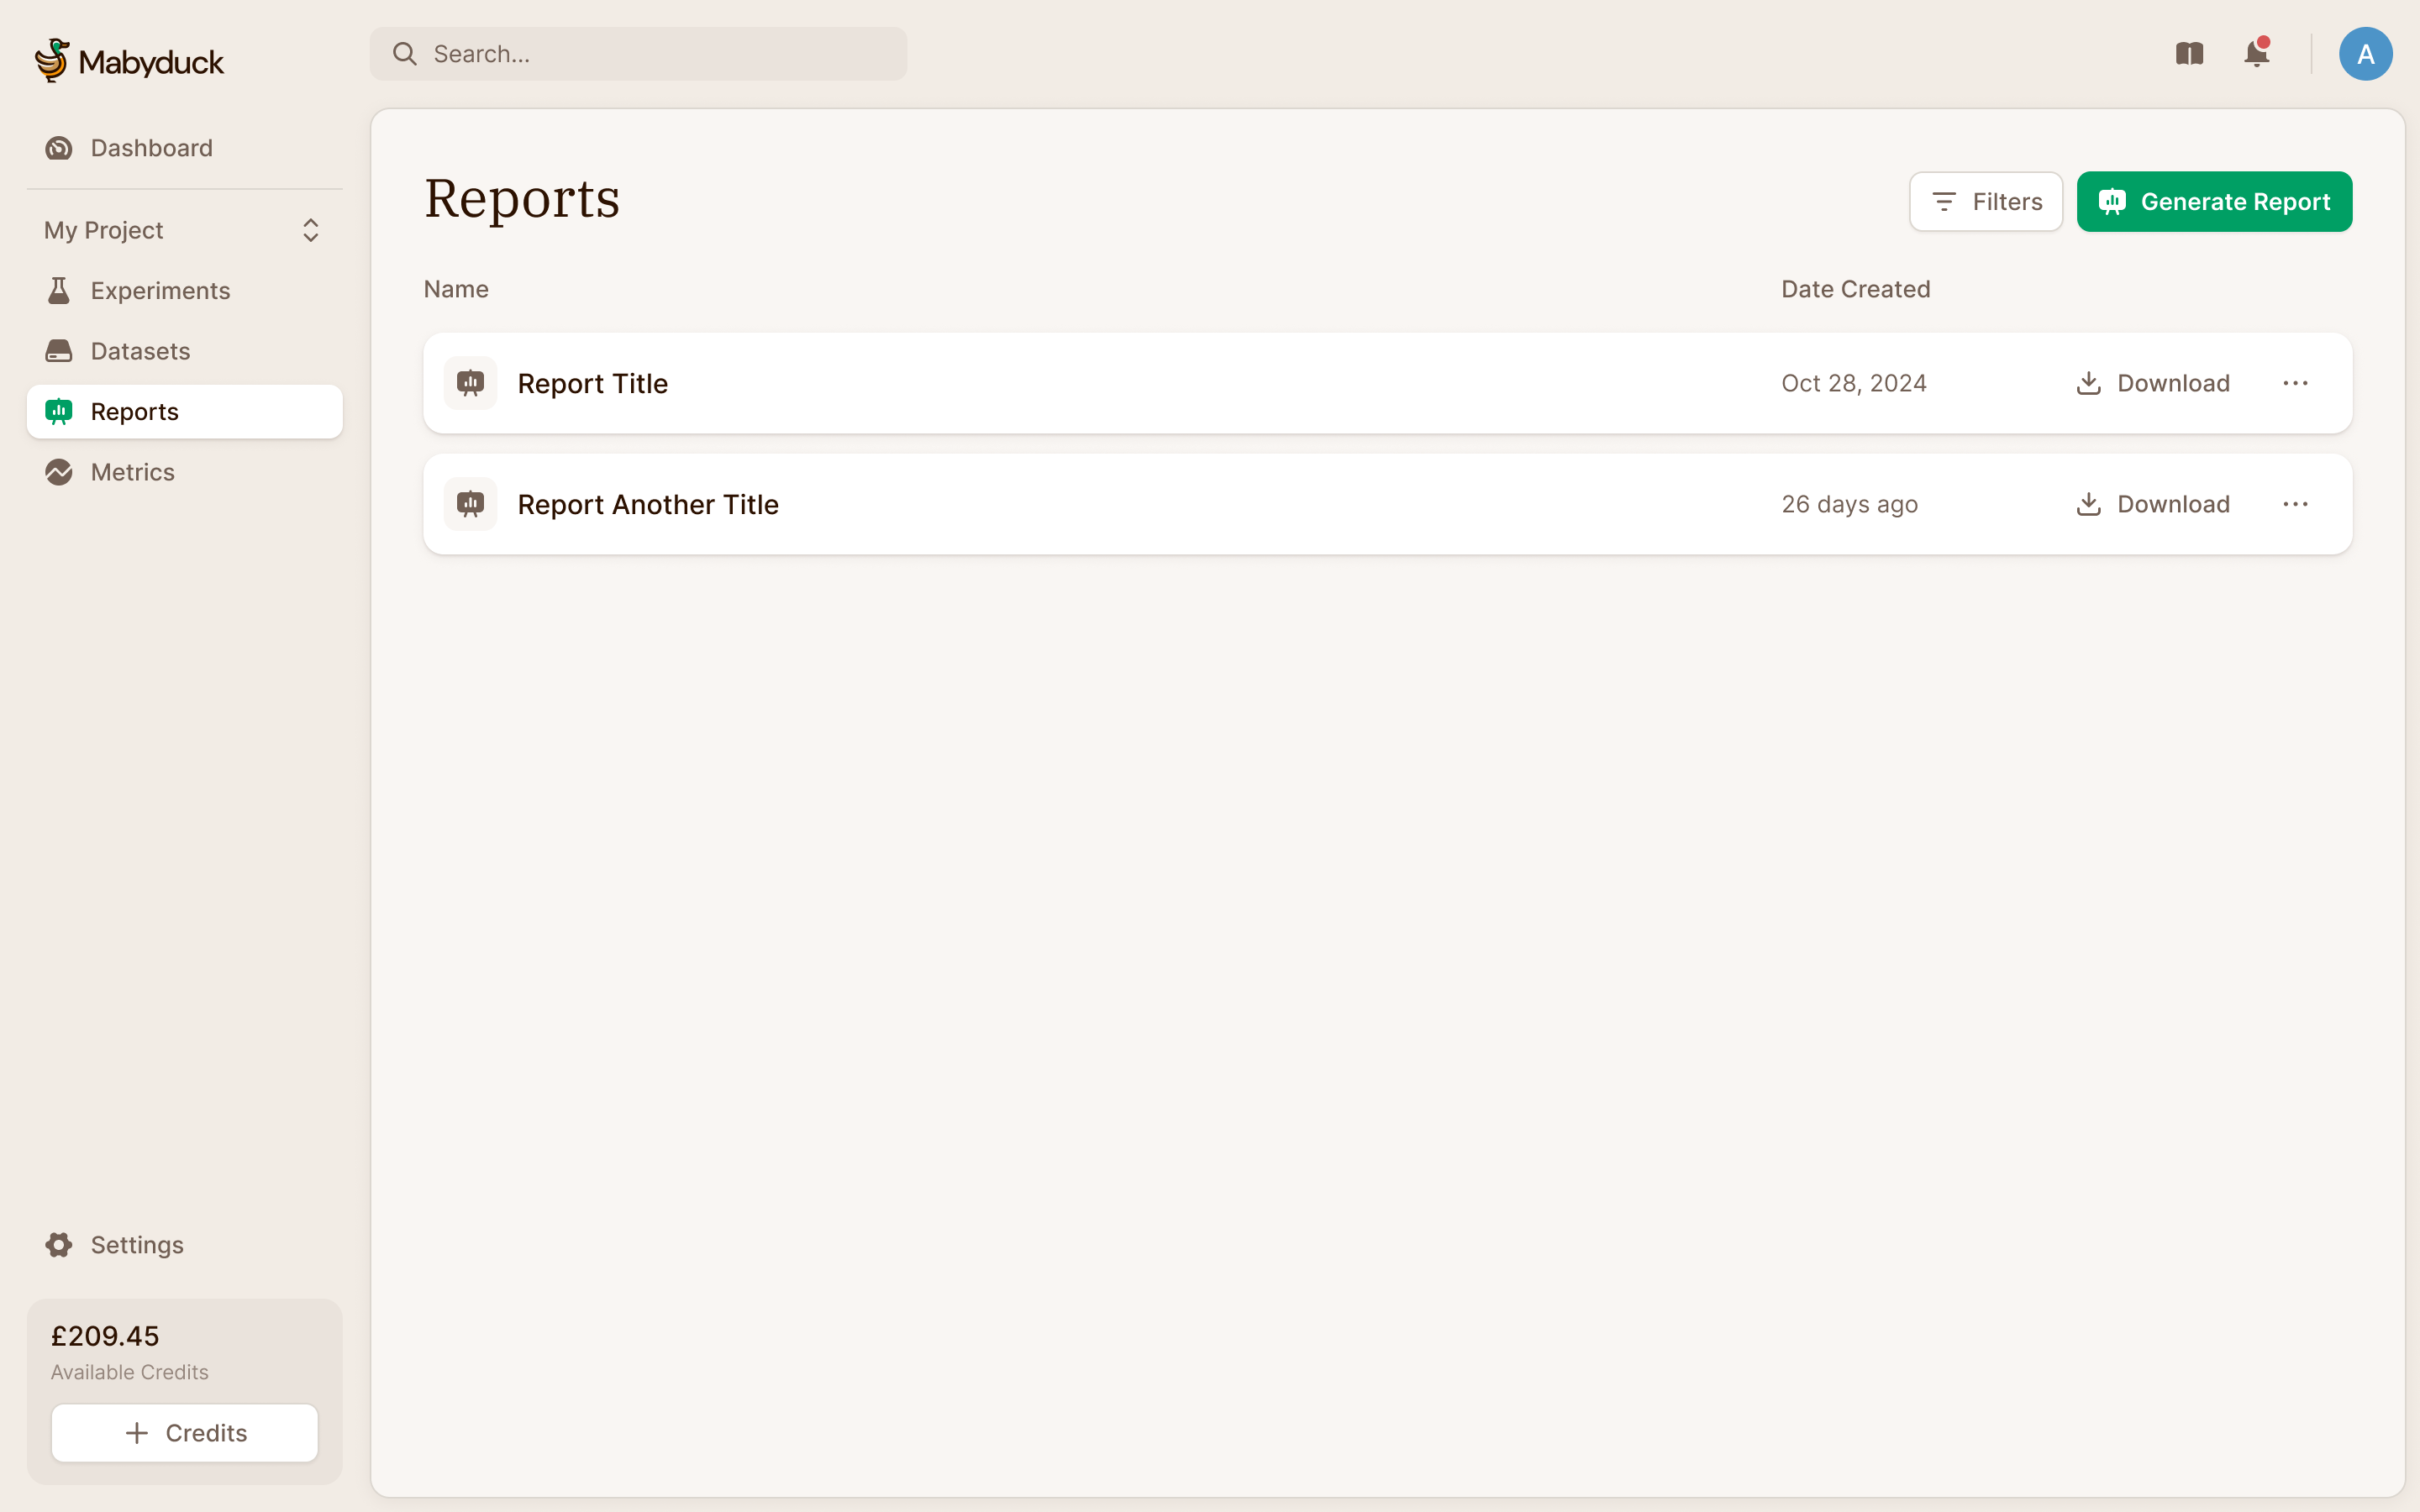
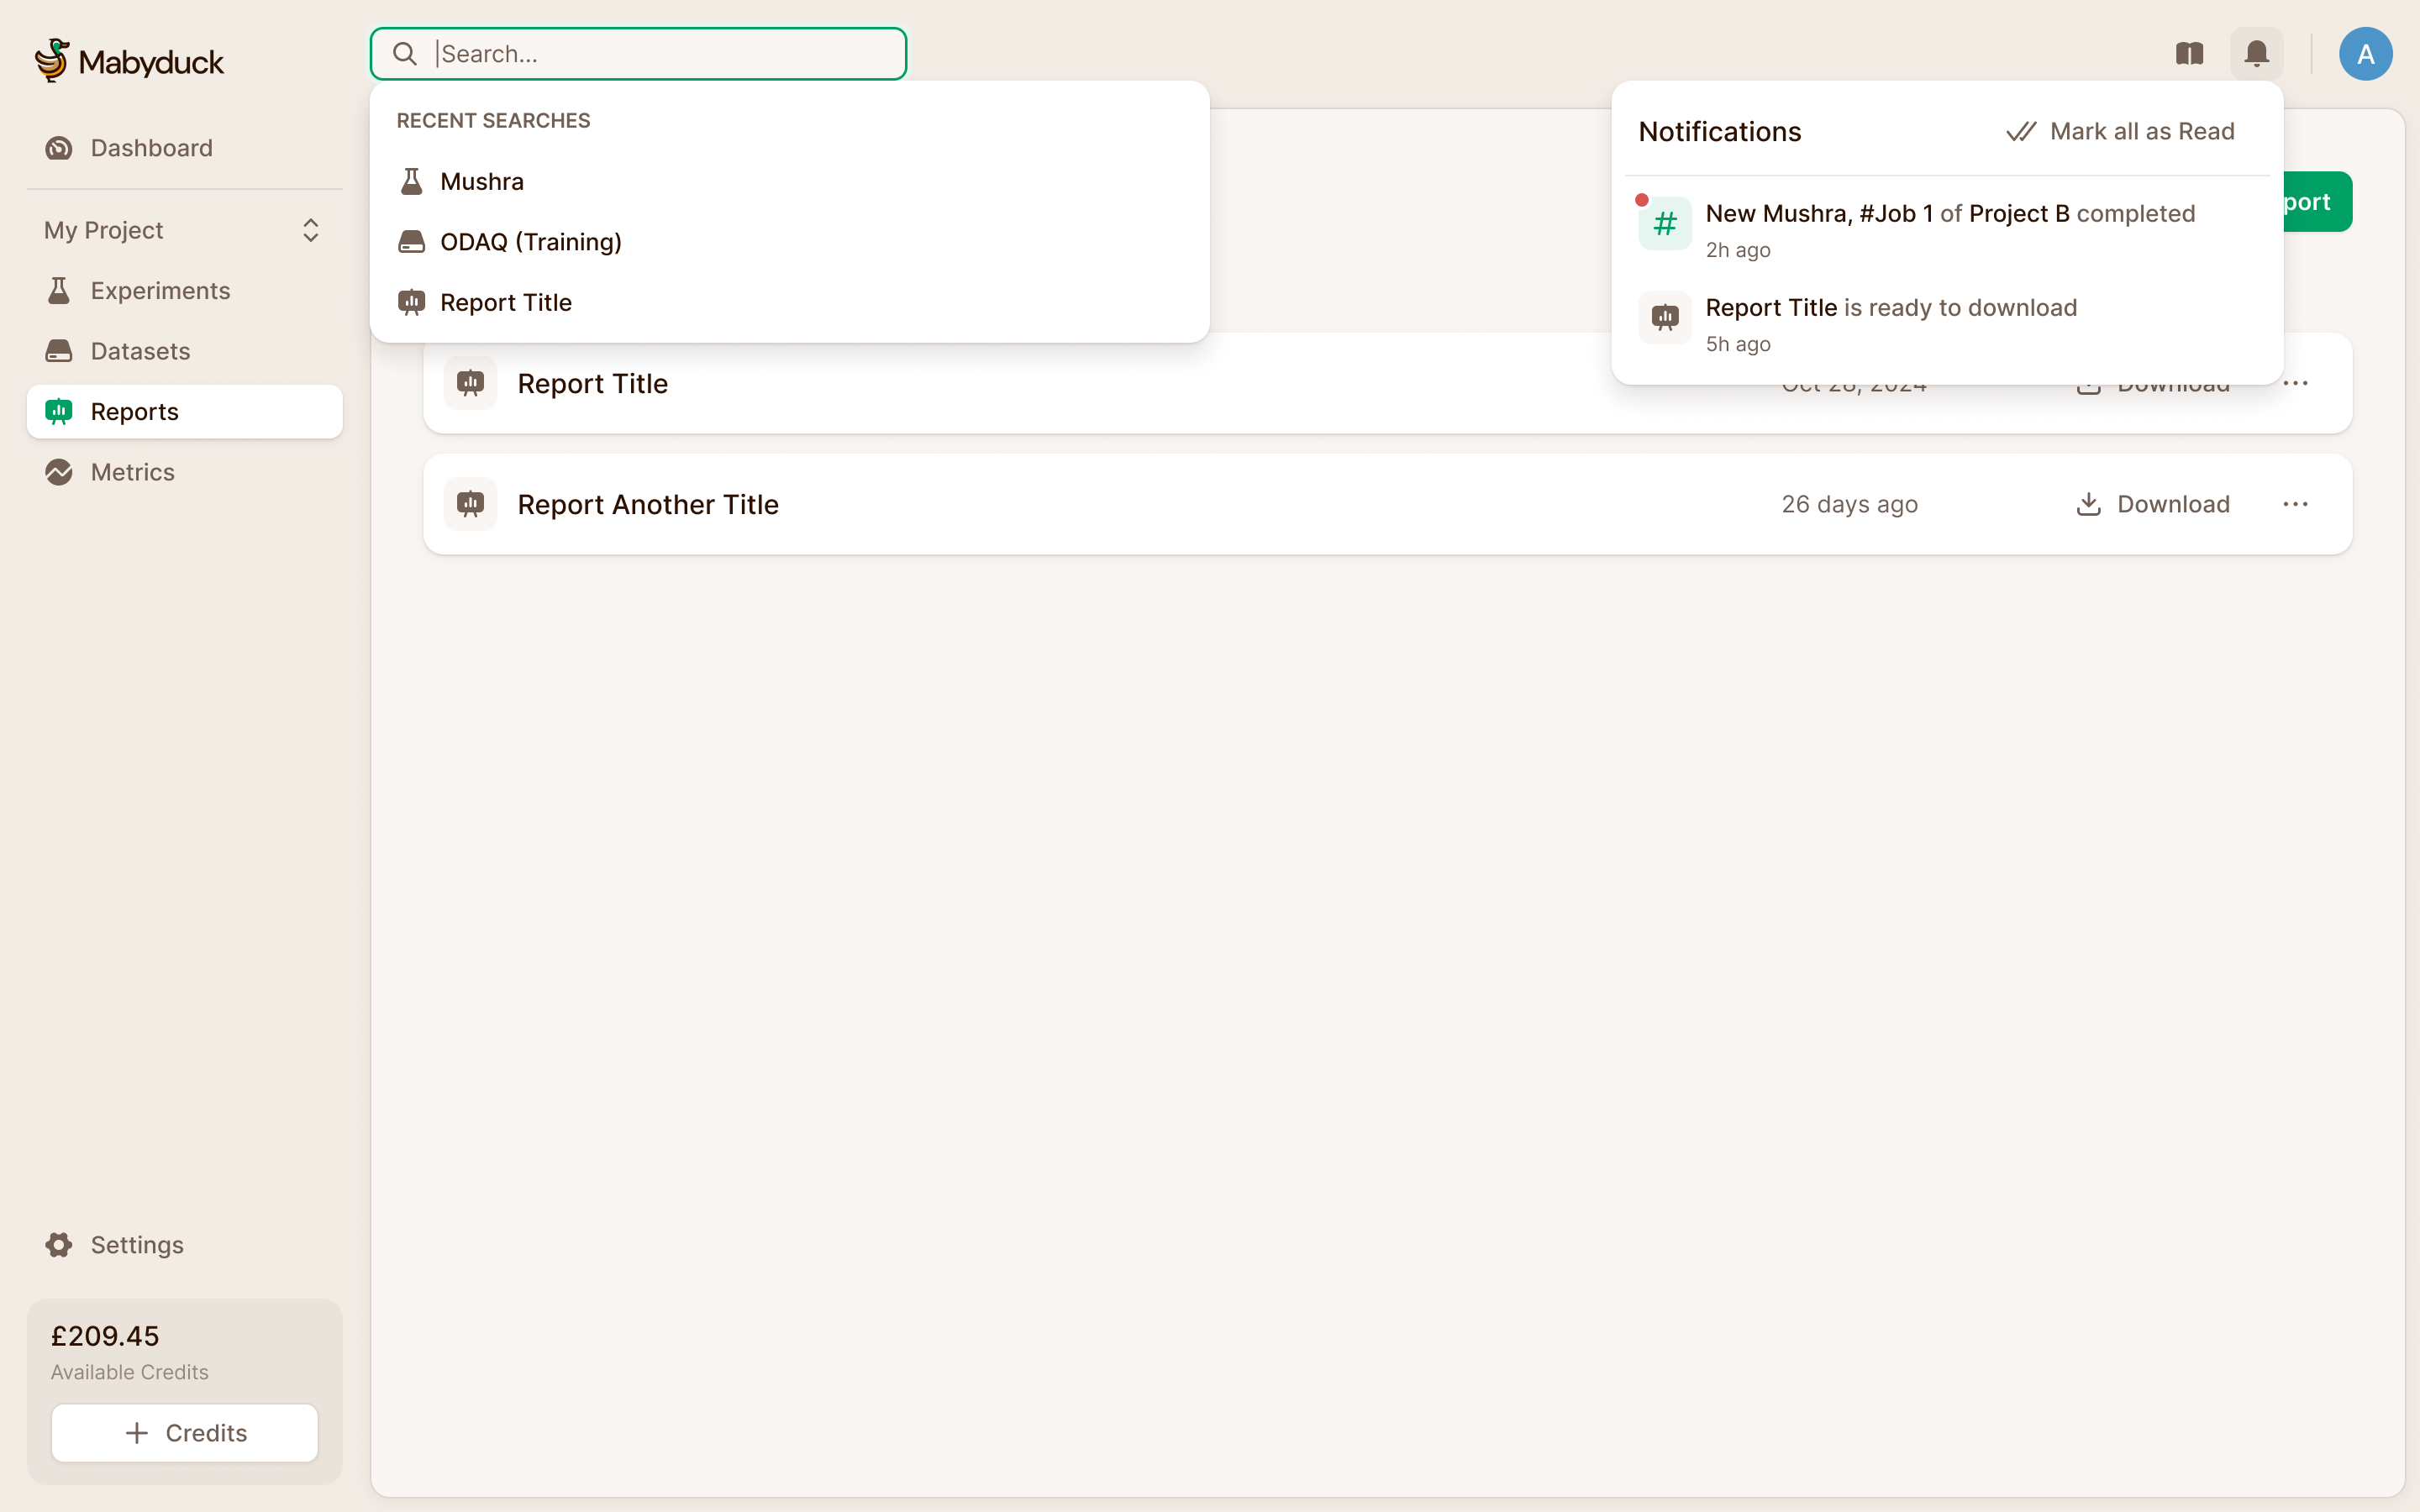
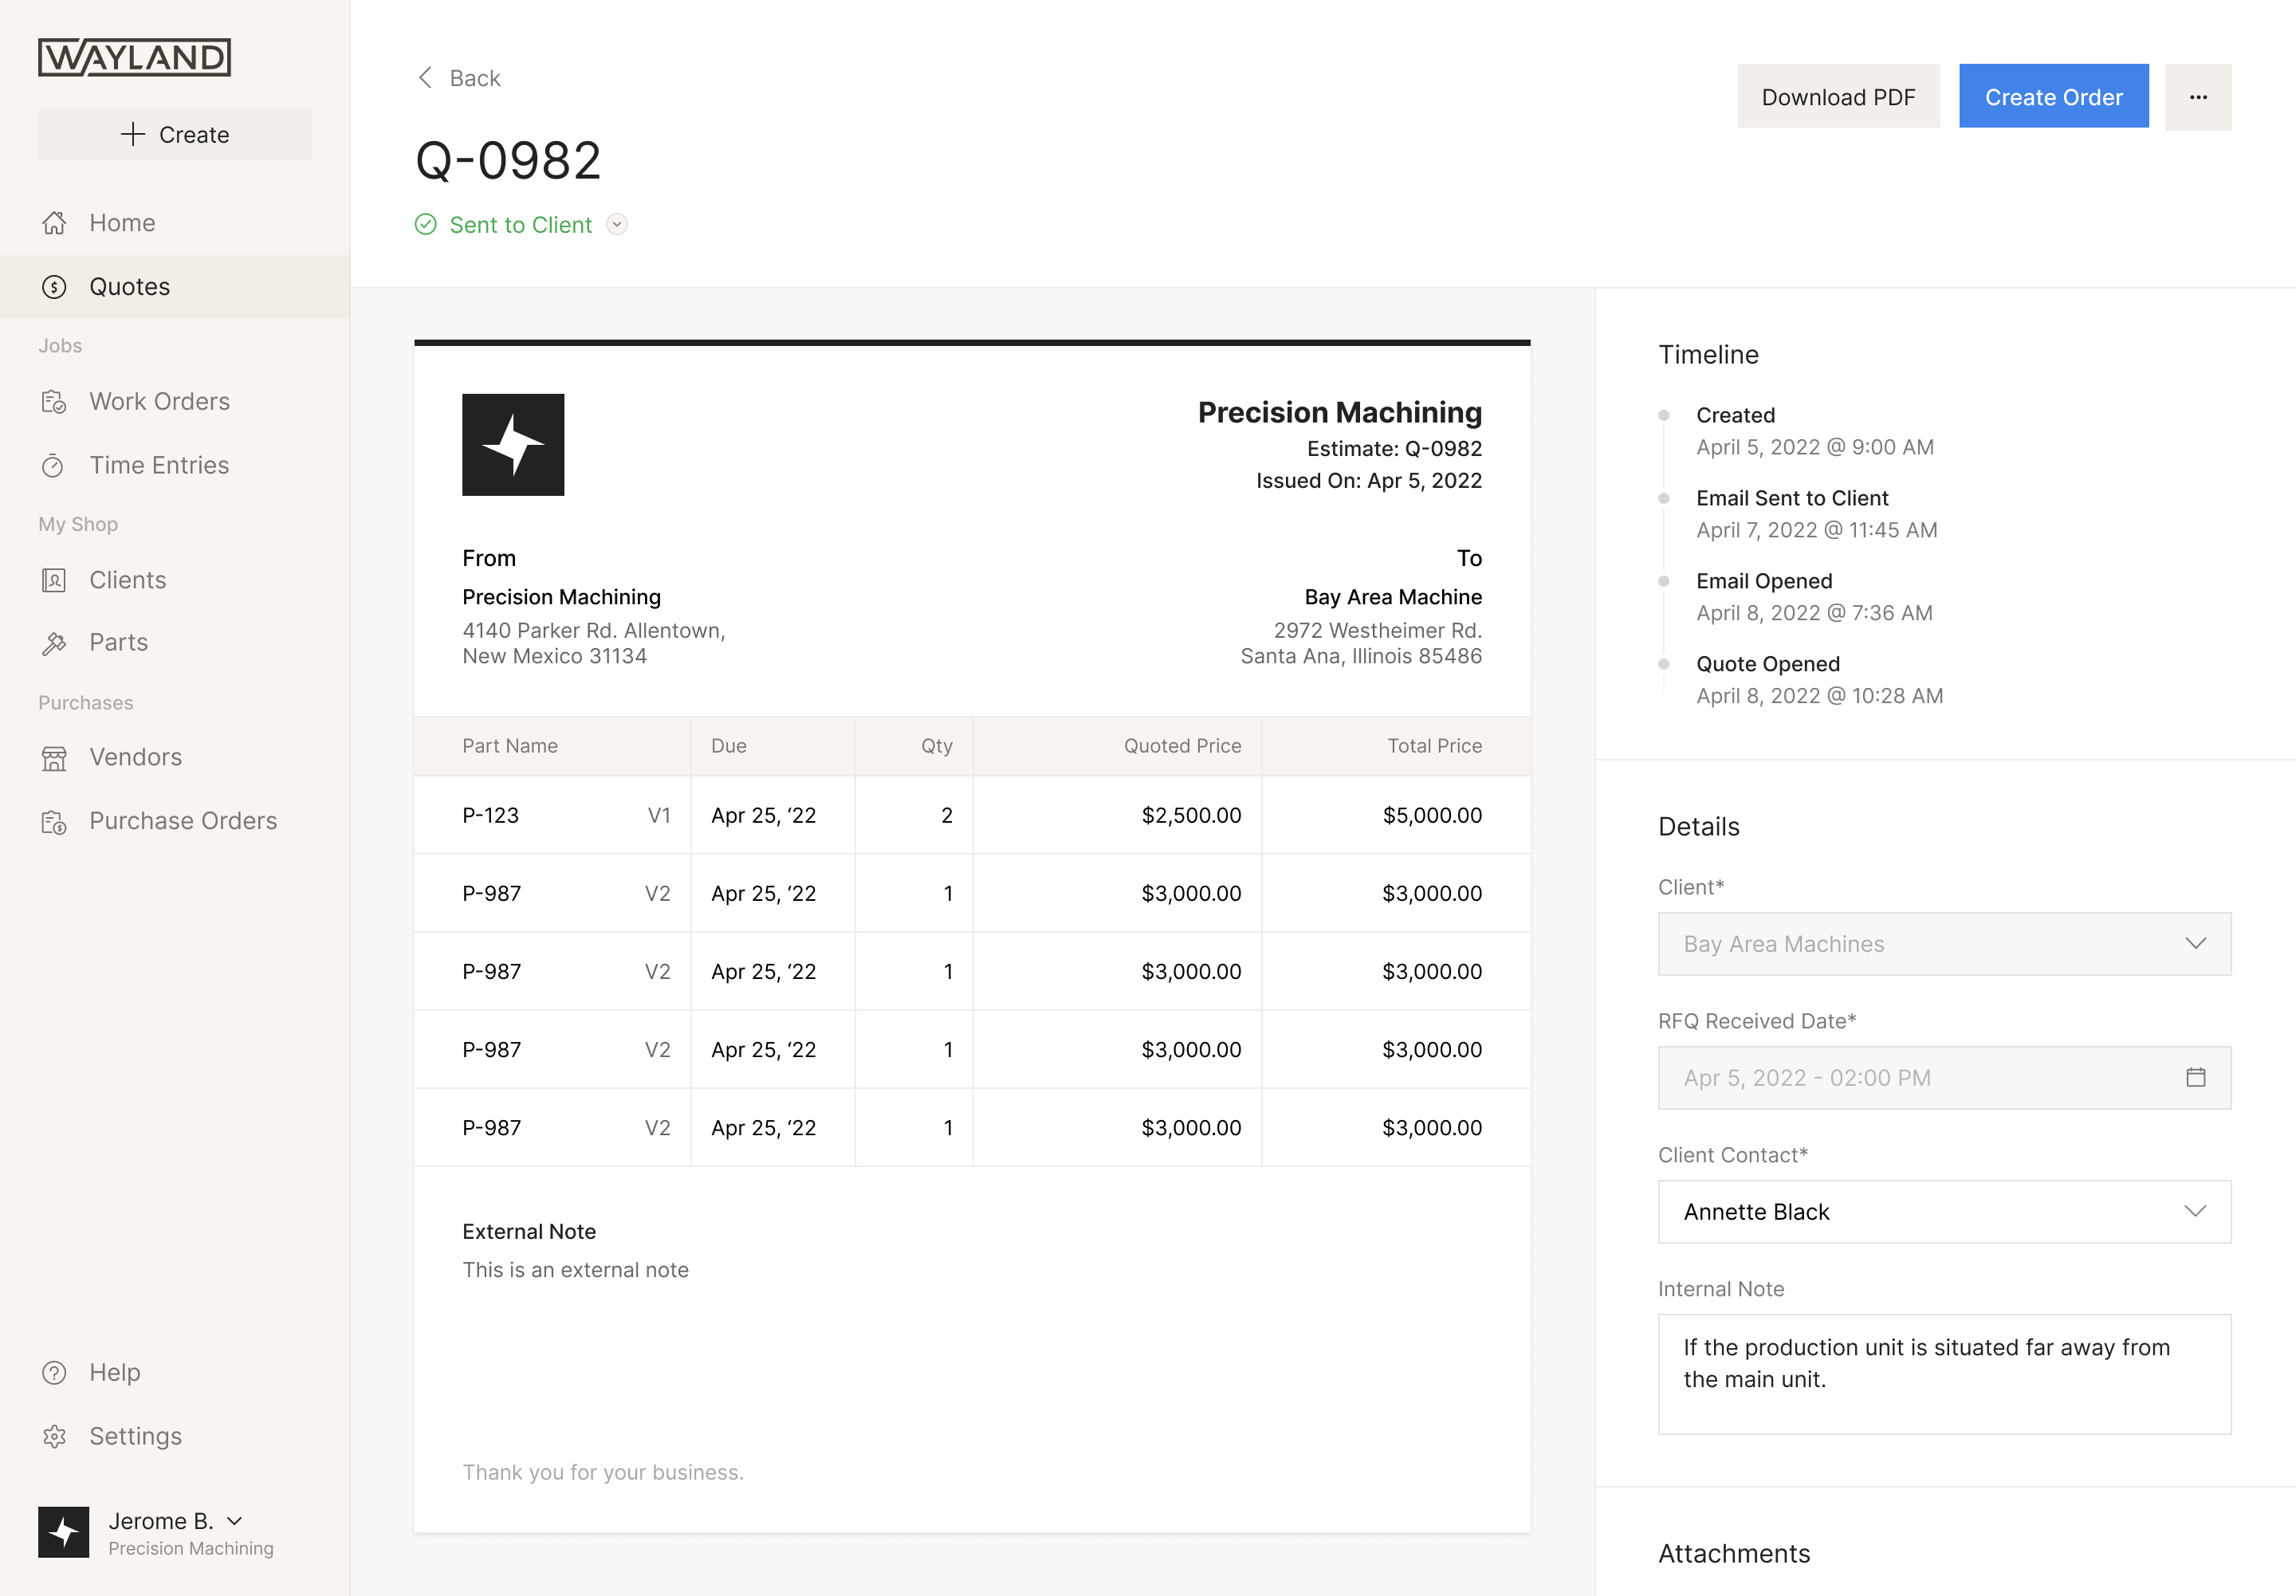
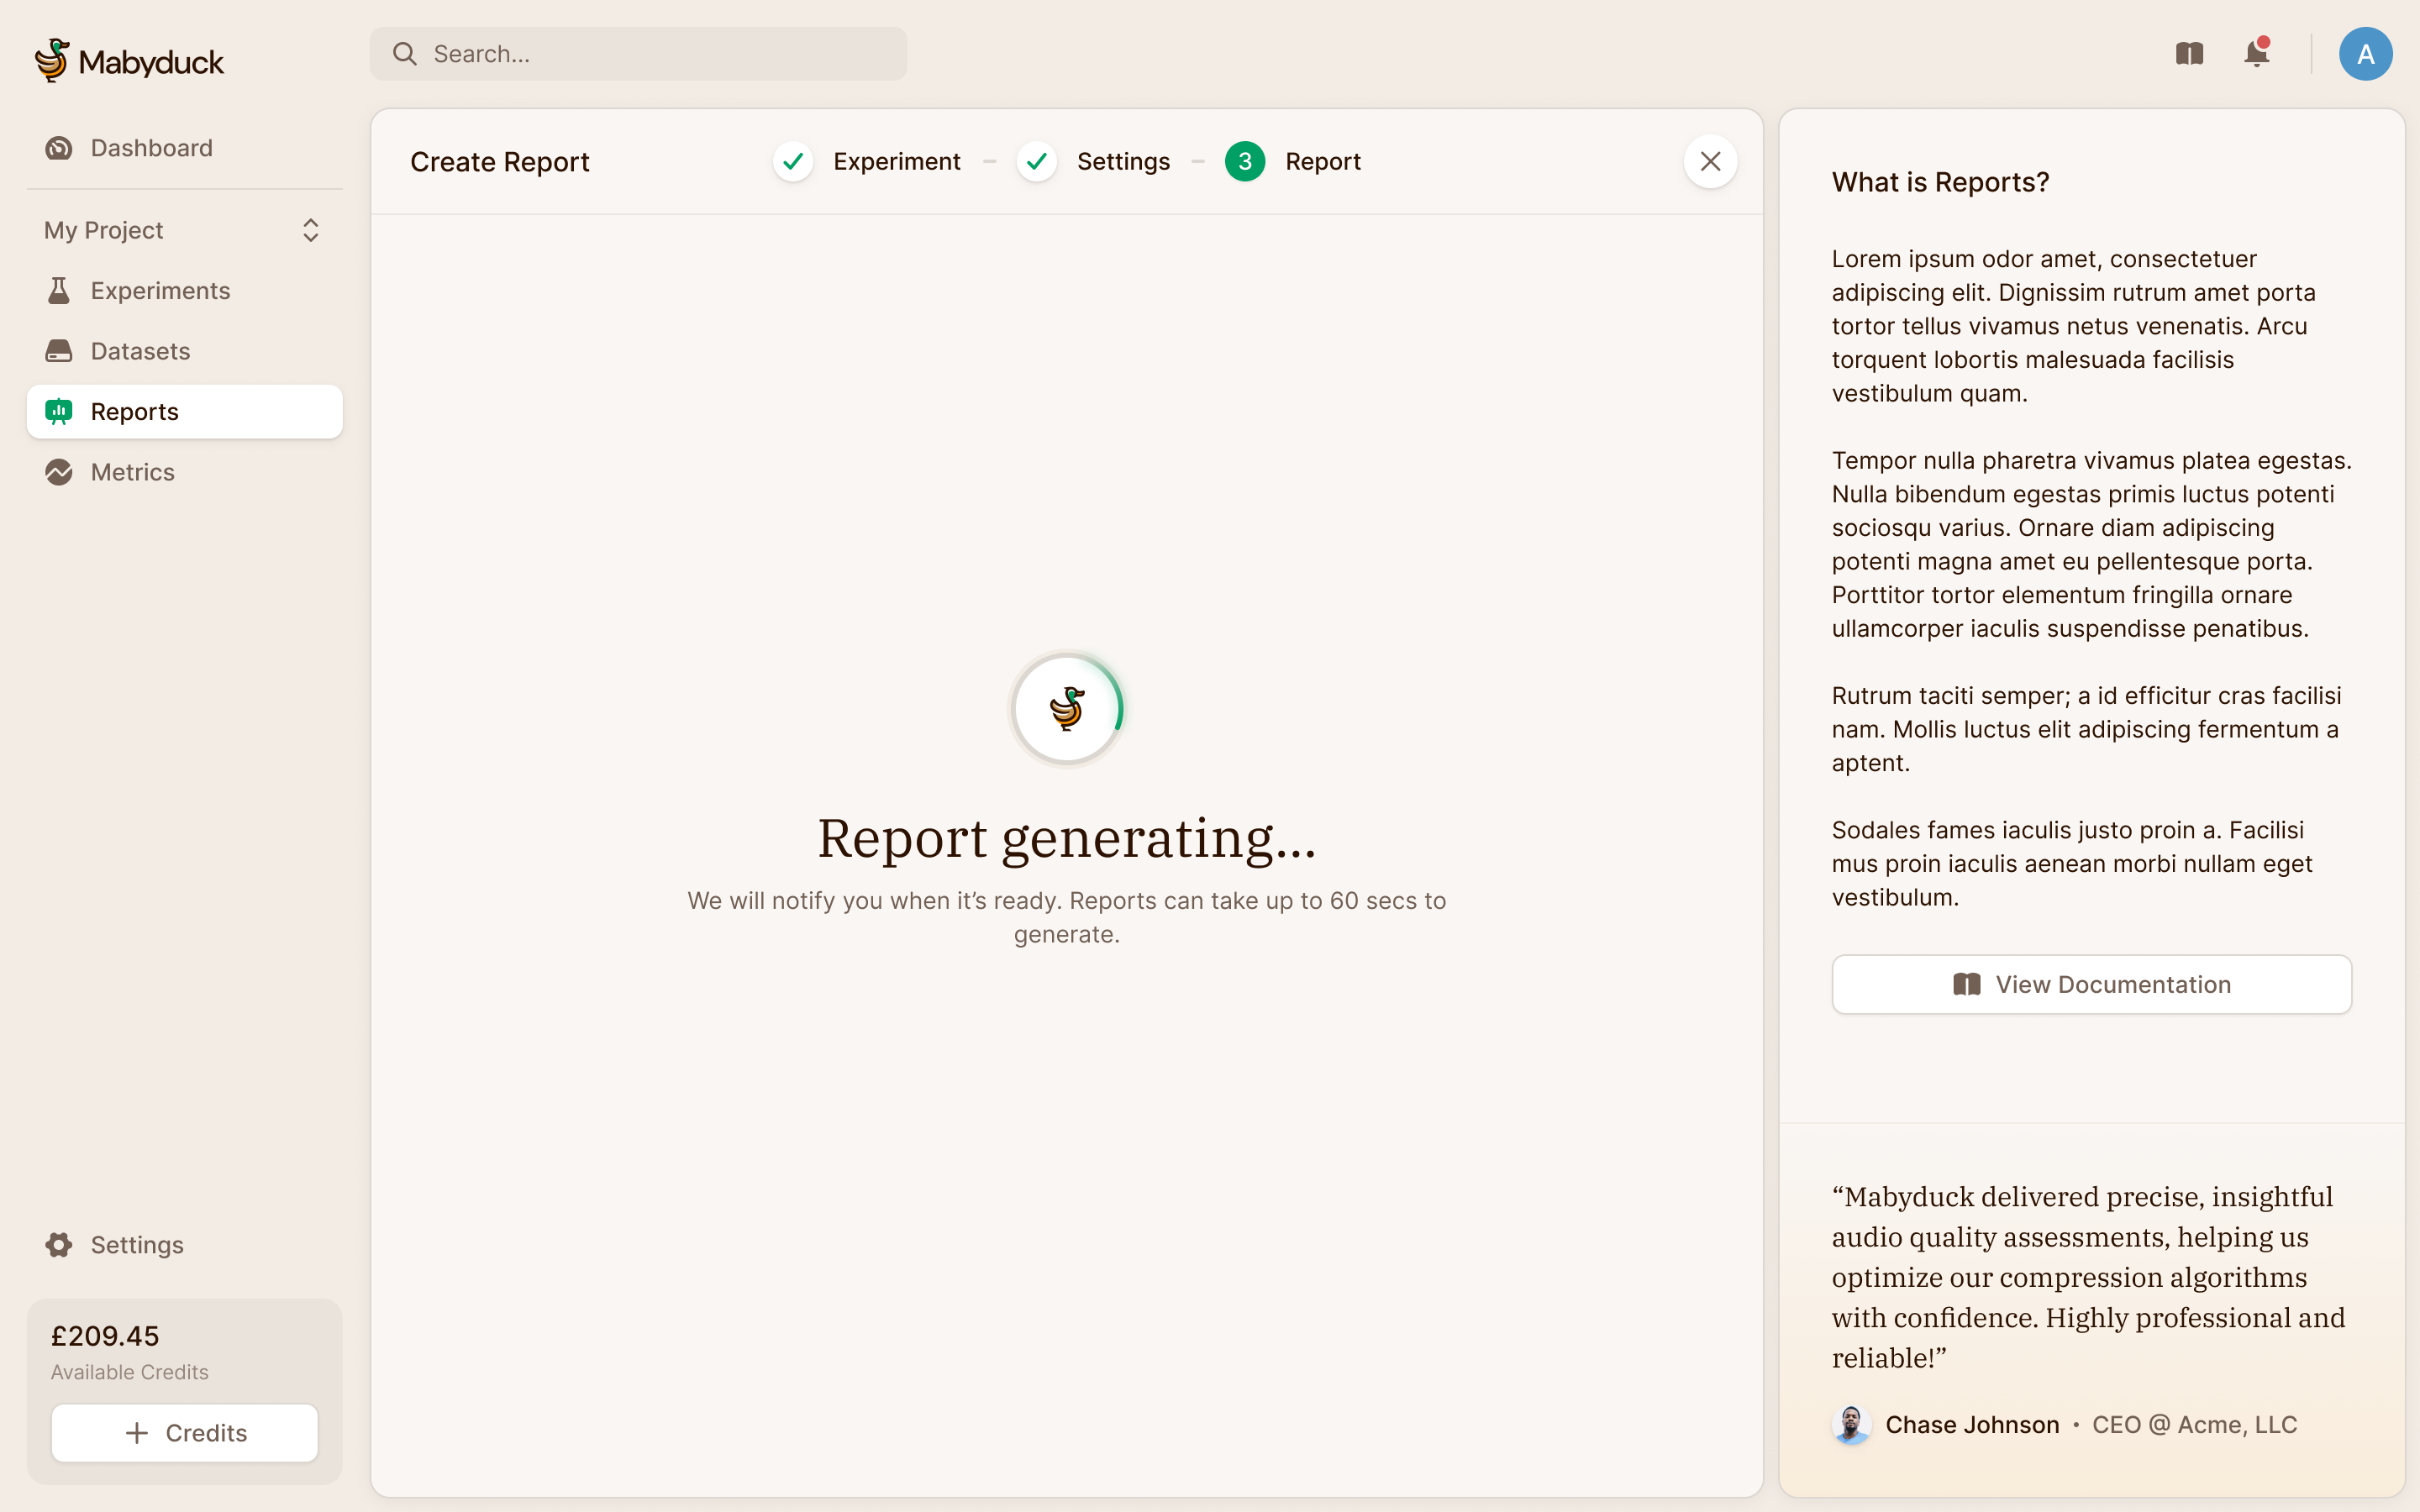
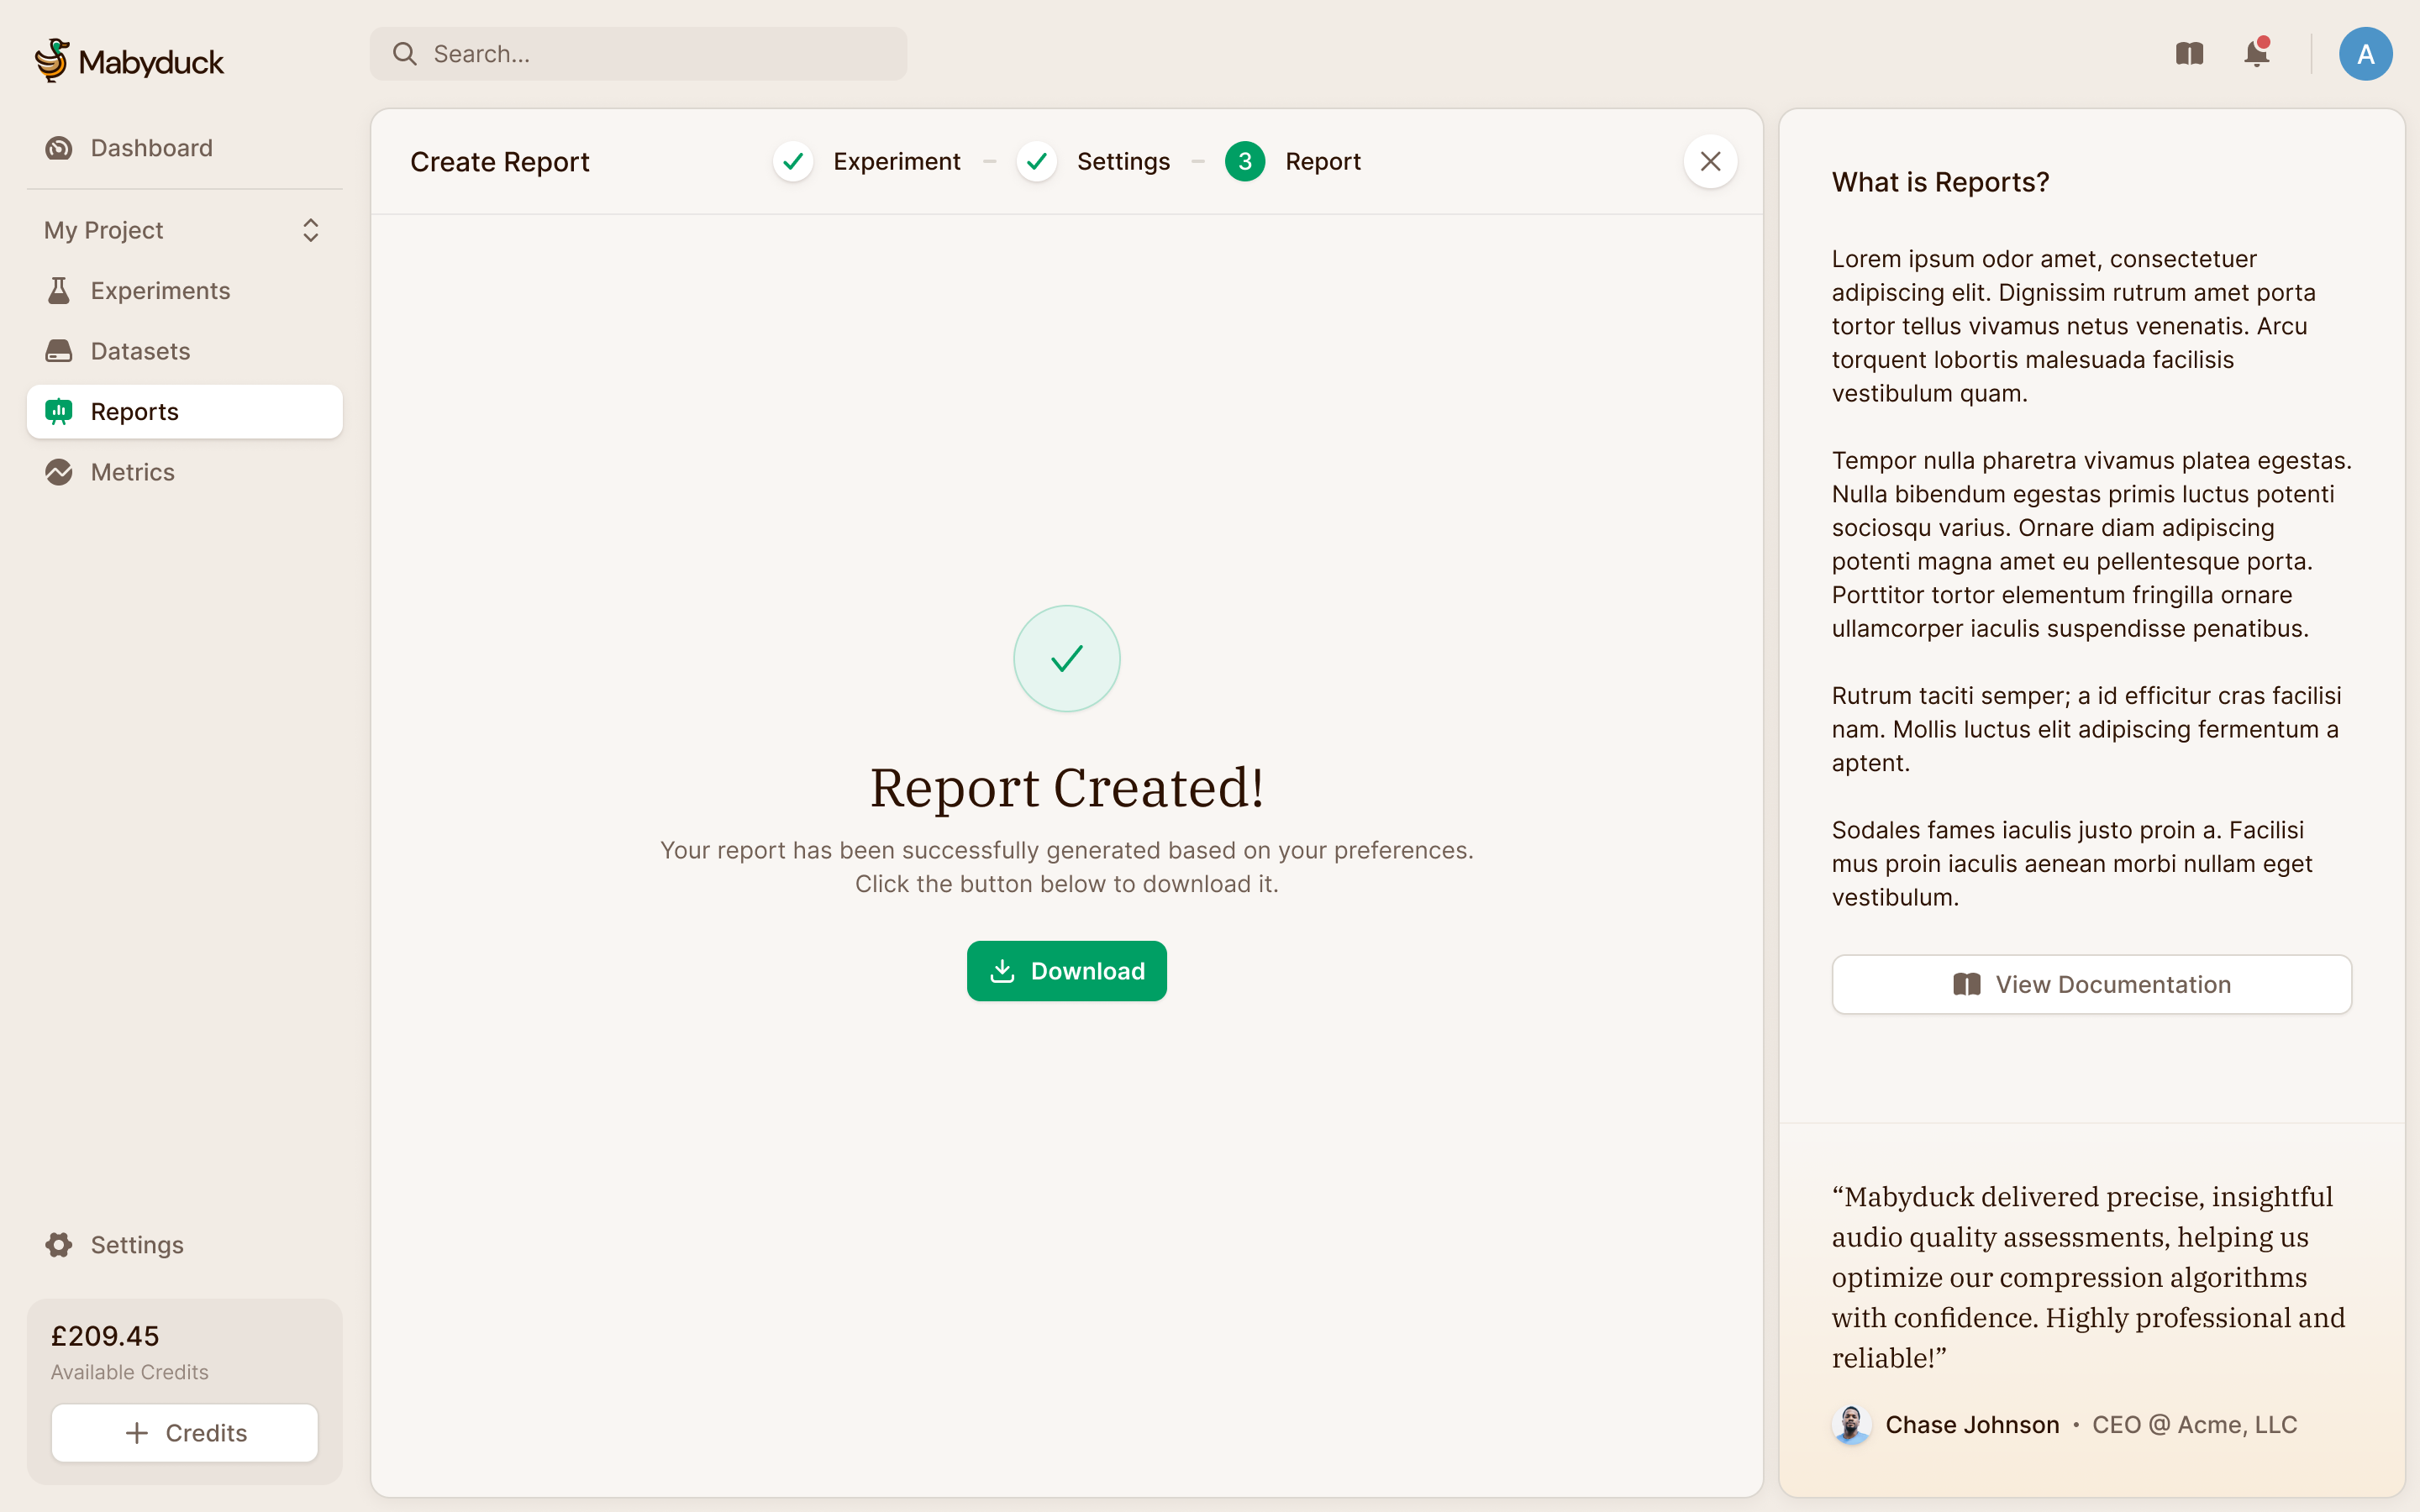
Lucas wanted reports to be downloadable PDFs, with the possibility of other formats. A report can combine several experiments, so we designed selection into its creation flow rather than treating every report as an export of the page currently open. Compiling takes long enough that we didn't want anyone watching a spinner, so Mabyduck emails you when it's ready, and offers the download if you've stayed. The report list keeps earlier outputs available alongside new ones.
Thousands of sessions, read in two rows
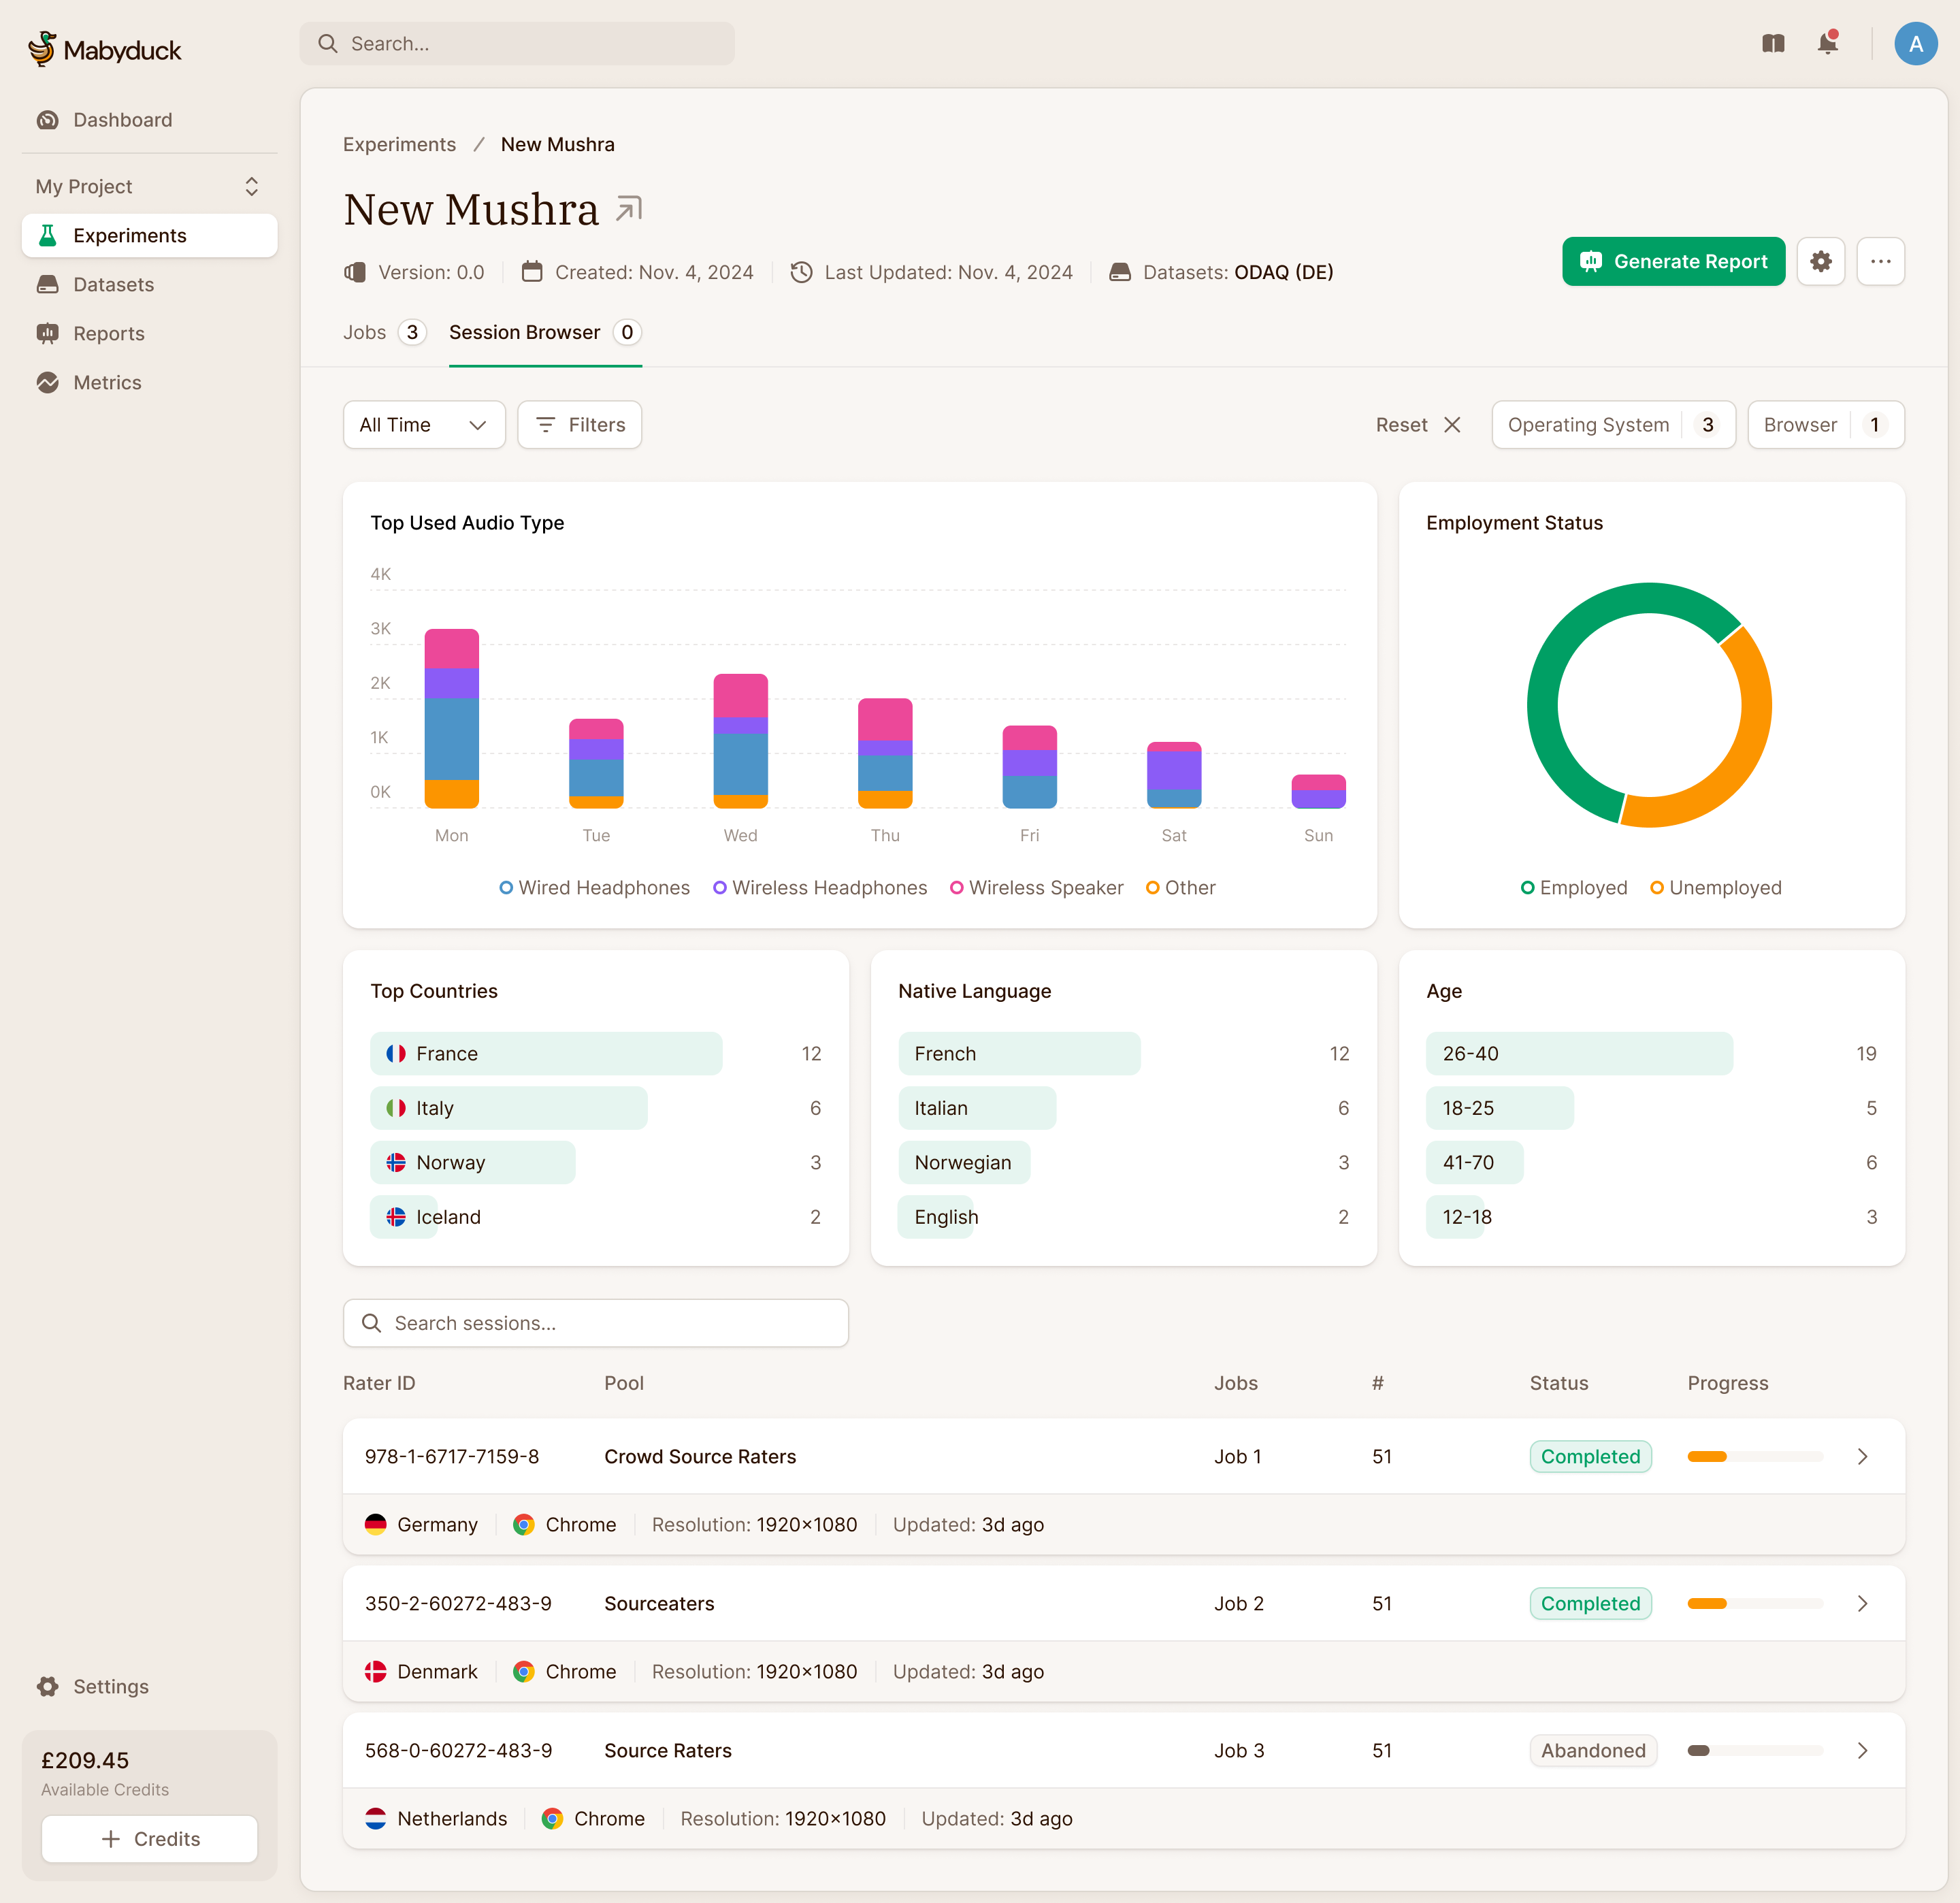
In 2025 Lucas brought us back to design what happens after an experiment runs. A study can produce hundreds or thousands of rater sessions. Our first card-based design looked good, but Lucas pushed back on how much height each session took. Even the existing, smaller cards were using more space than he wanted.
We explored a conventional table and a two-row layout. In the latter, the first row holds the session's identity, job, status and progress. The quieter row underneath holds context such as country, browser and screen resolution. That keeps secondary information available without asking it to compete with the state of the work. Lucas and his team chose that compromise.
We also opened the page to the full browser width. Lucas pointed out that the existing layout left much of a wide monitor unused, even as we were struggling to fit the data.
The summary area needed to adapt to the study. Headphones matter when evaluating audio; screen resolution matters for video. We worked through configurable summaries with Lucas, so researchers could look at the relevant equipment and demographics before going through individual sessions. The design shown combines those summaries with the denser session list.
Inspect a blind test without changing its layout
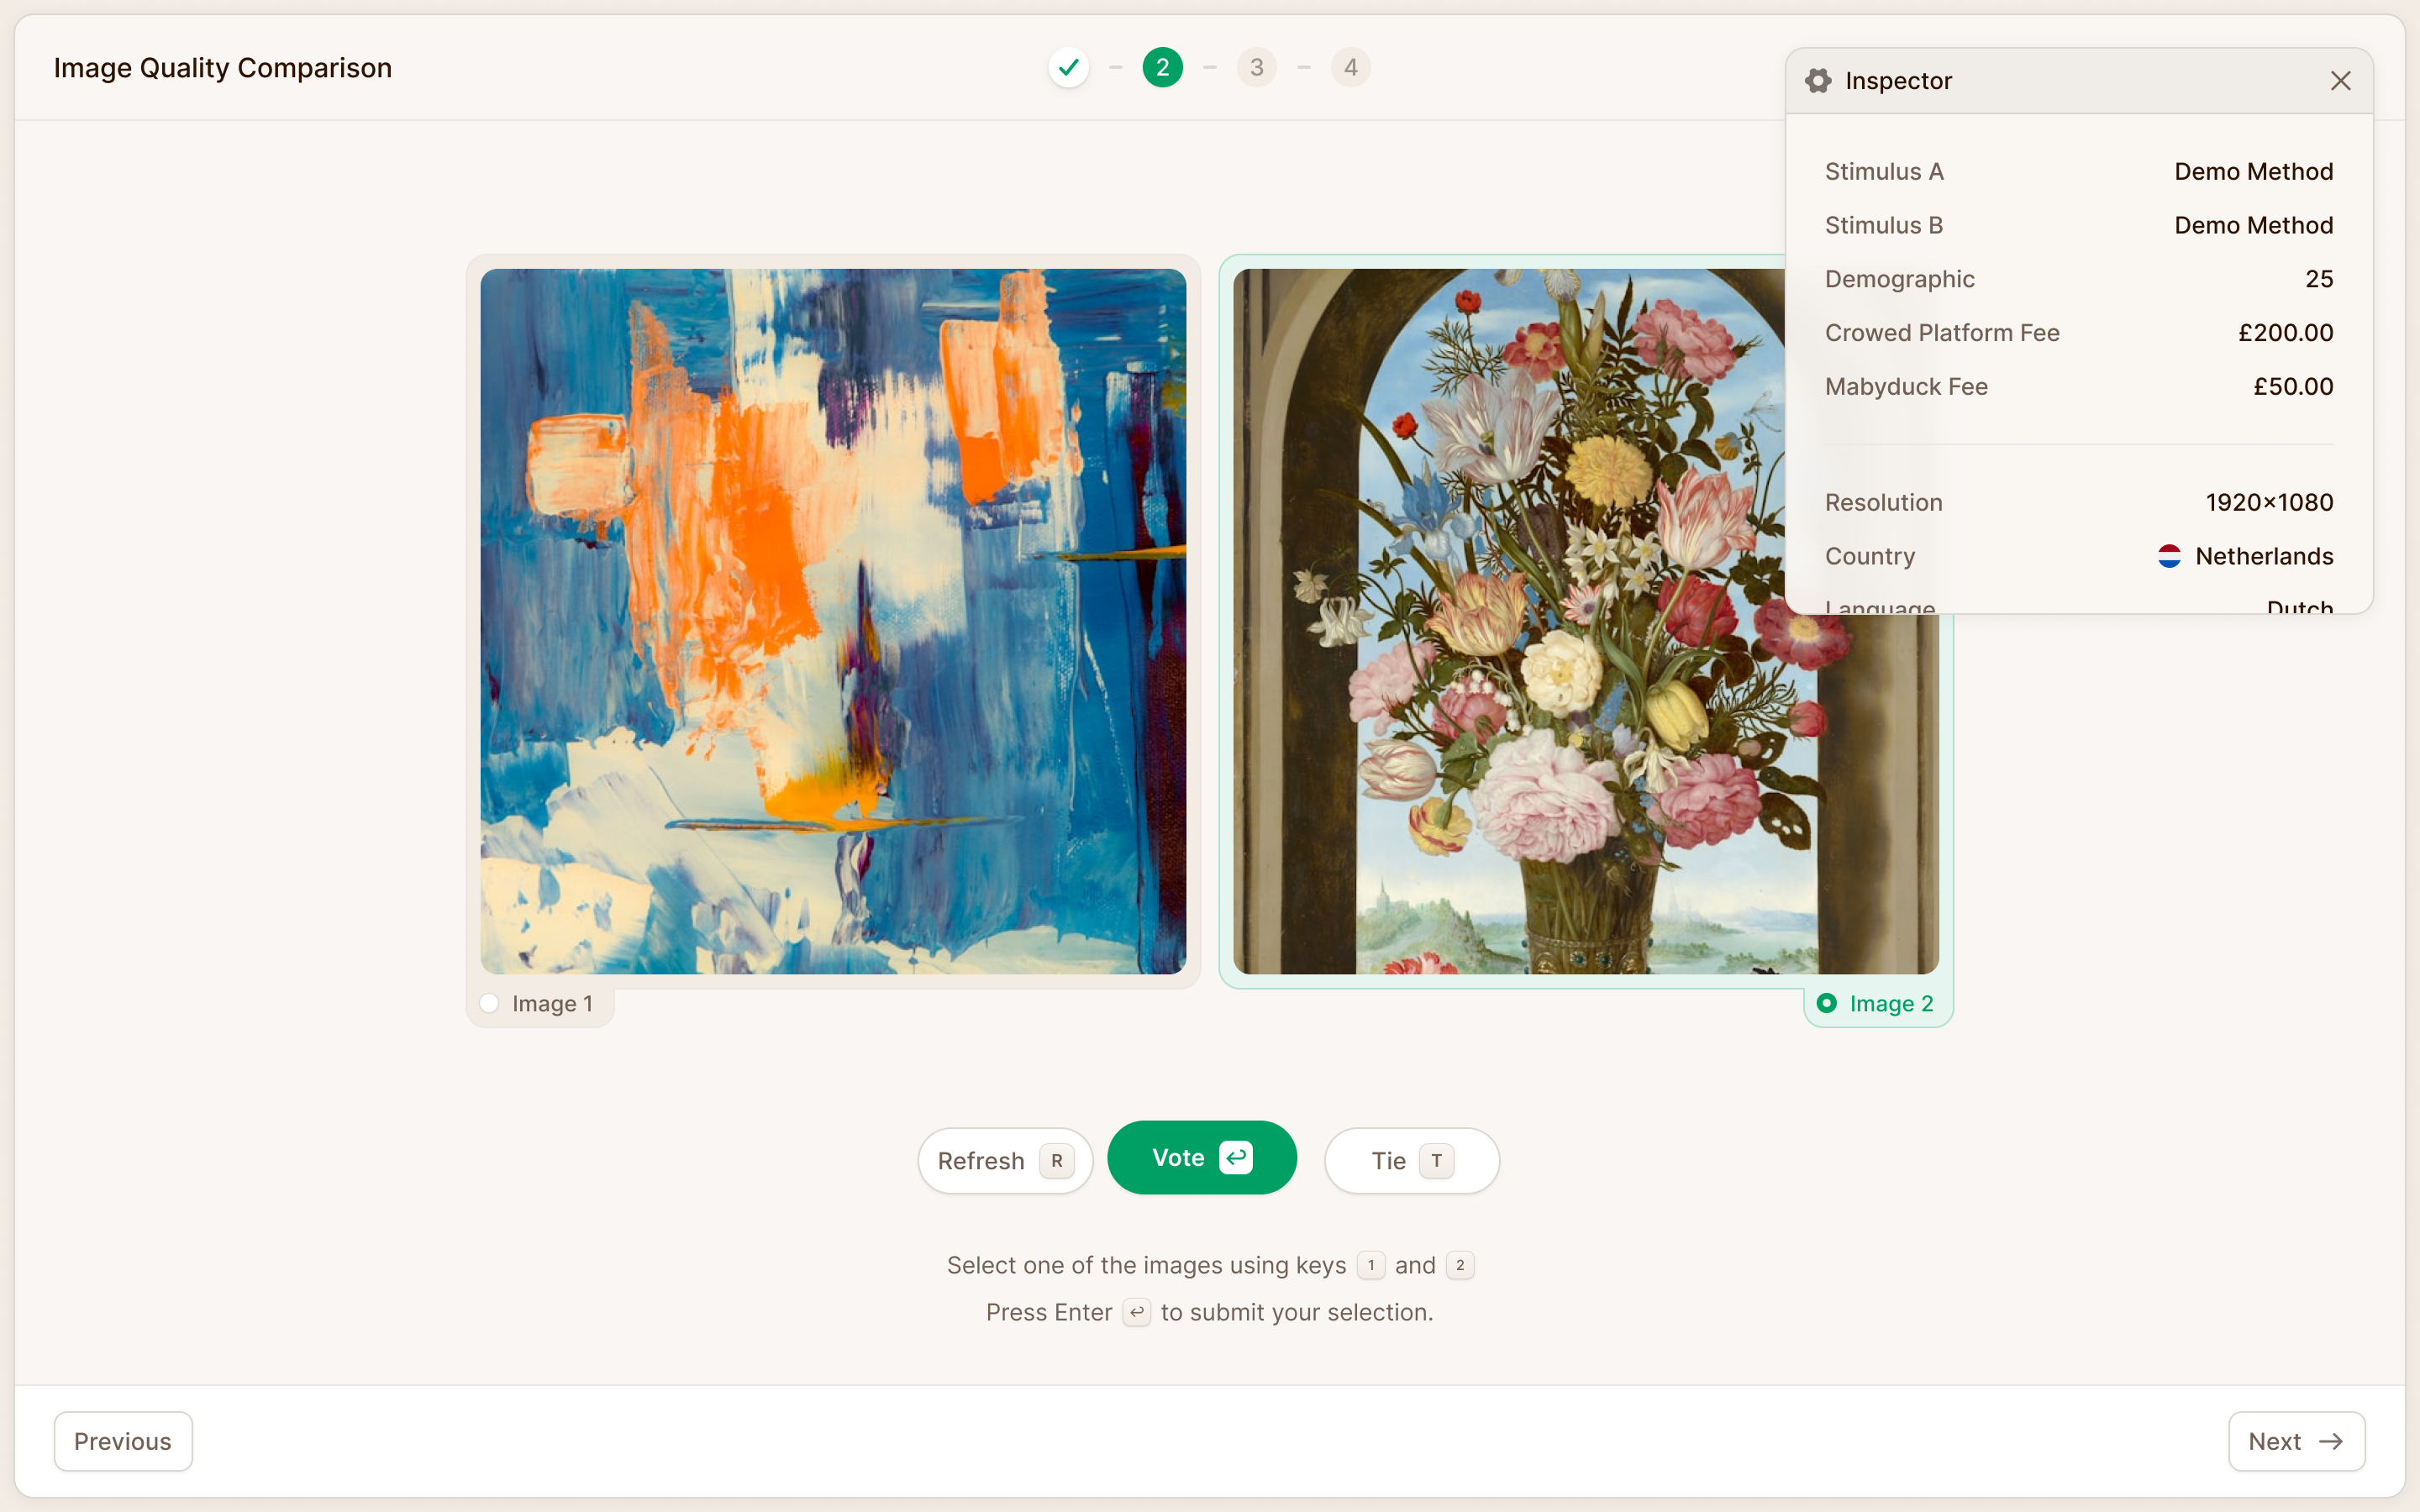
Lucas brought us a more subtle problem with replay. A researcher could step through a rater's session, but couldn't see which model had produced stimulus A or B. Those identities were hidden for a reason during the study. During analysis, the researcher needed them.
Lucas wanted the extra information in an overlay, because changing the dimensions of the underlying interface would change the view he was trying to inspect. I suggested the floating control used by Next.js for its development overlay. Lucas added that it should be movable and leave the media usable while the information was open. A researcher comparing audio still needed to press play.
We designed the inspector as a separate panel over the replay, with method identities and rater context together. It could explain what the researcher was seeing without rebuilding the study into a different interface.
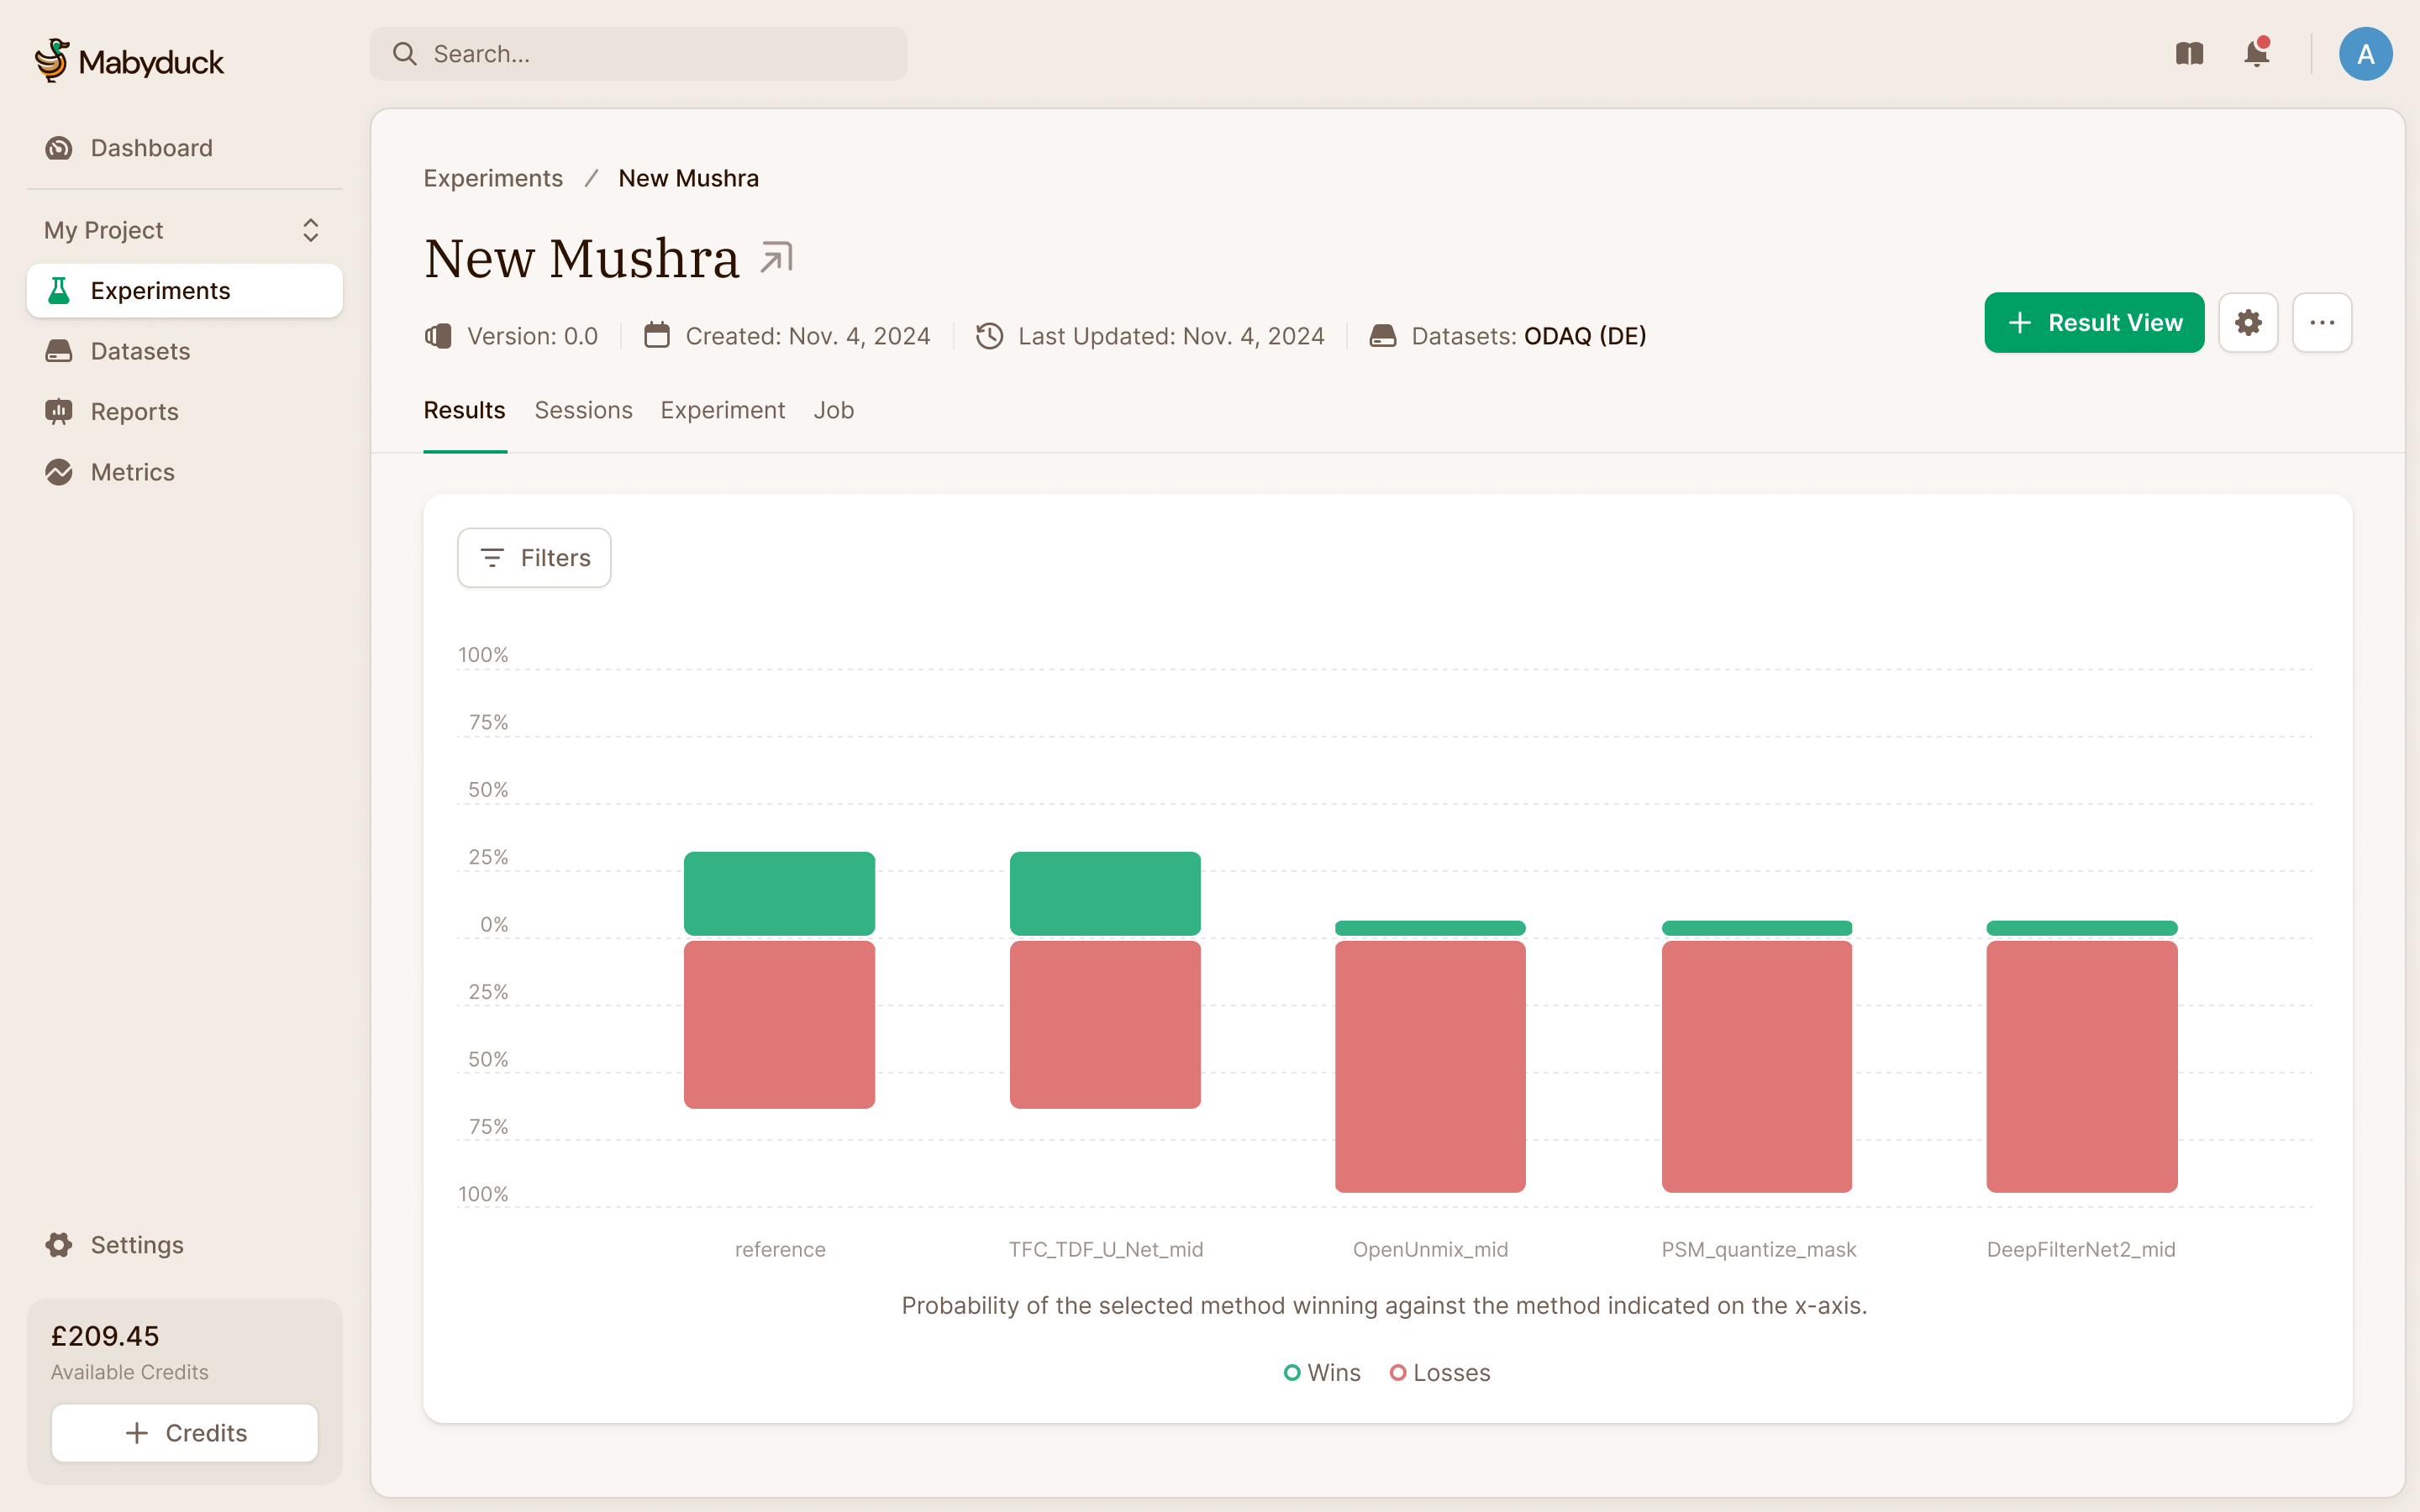
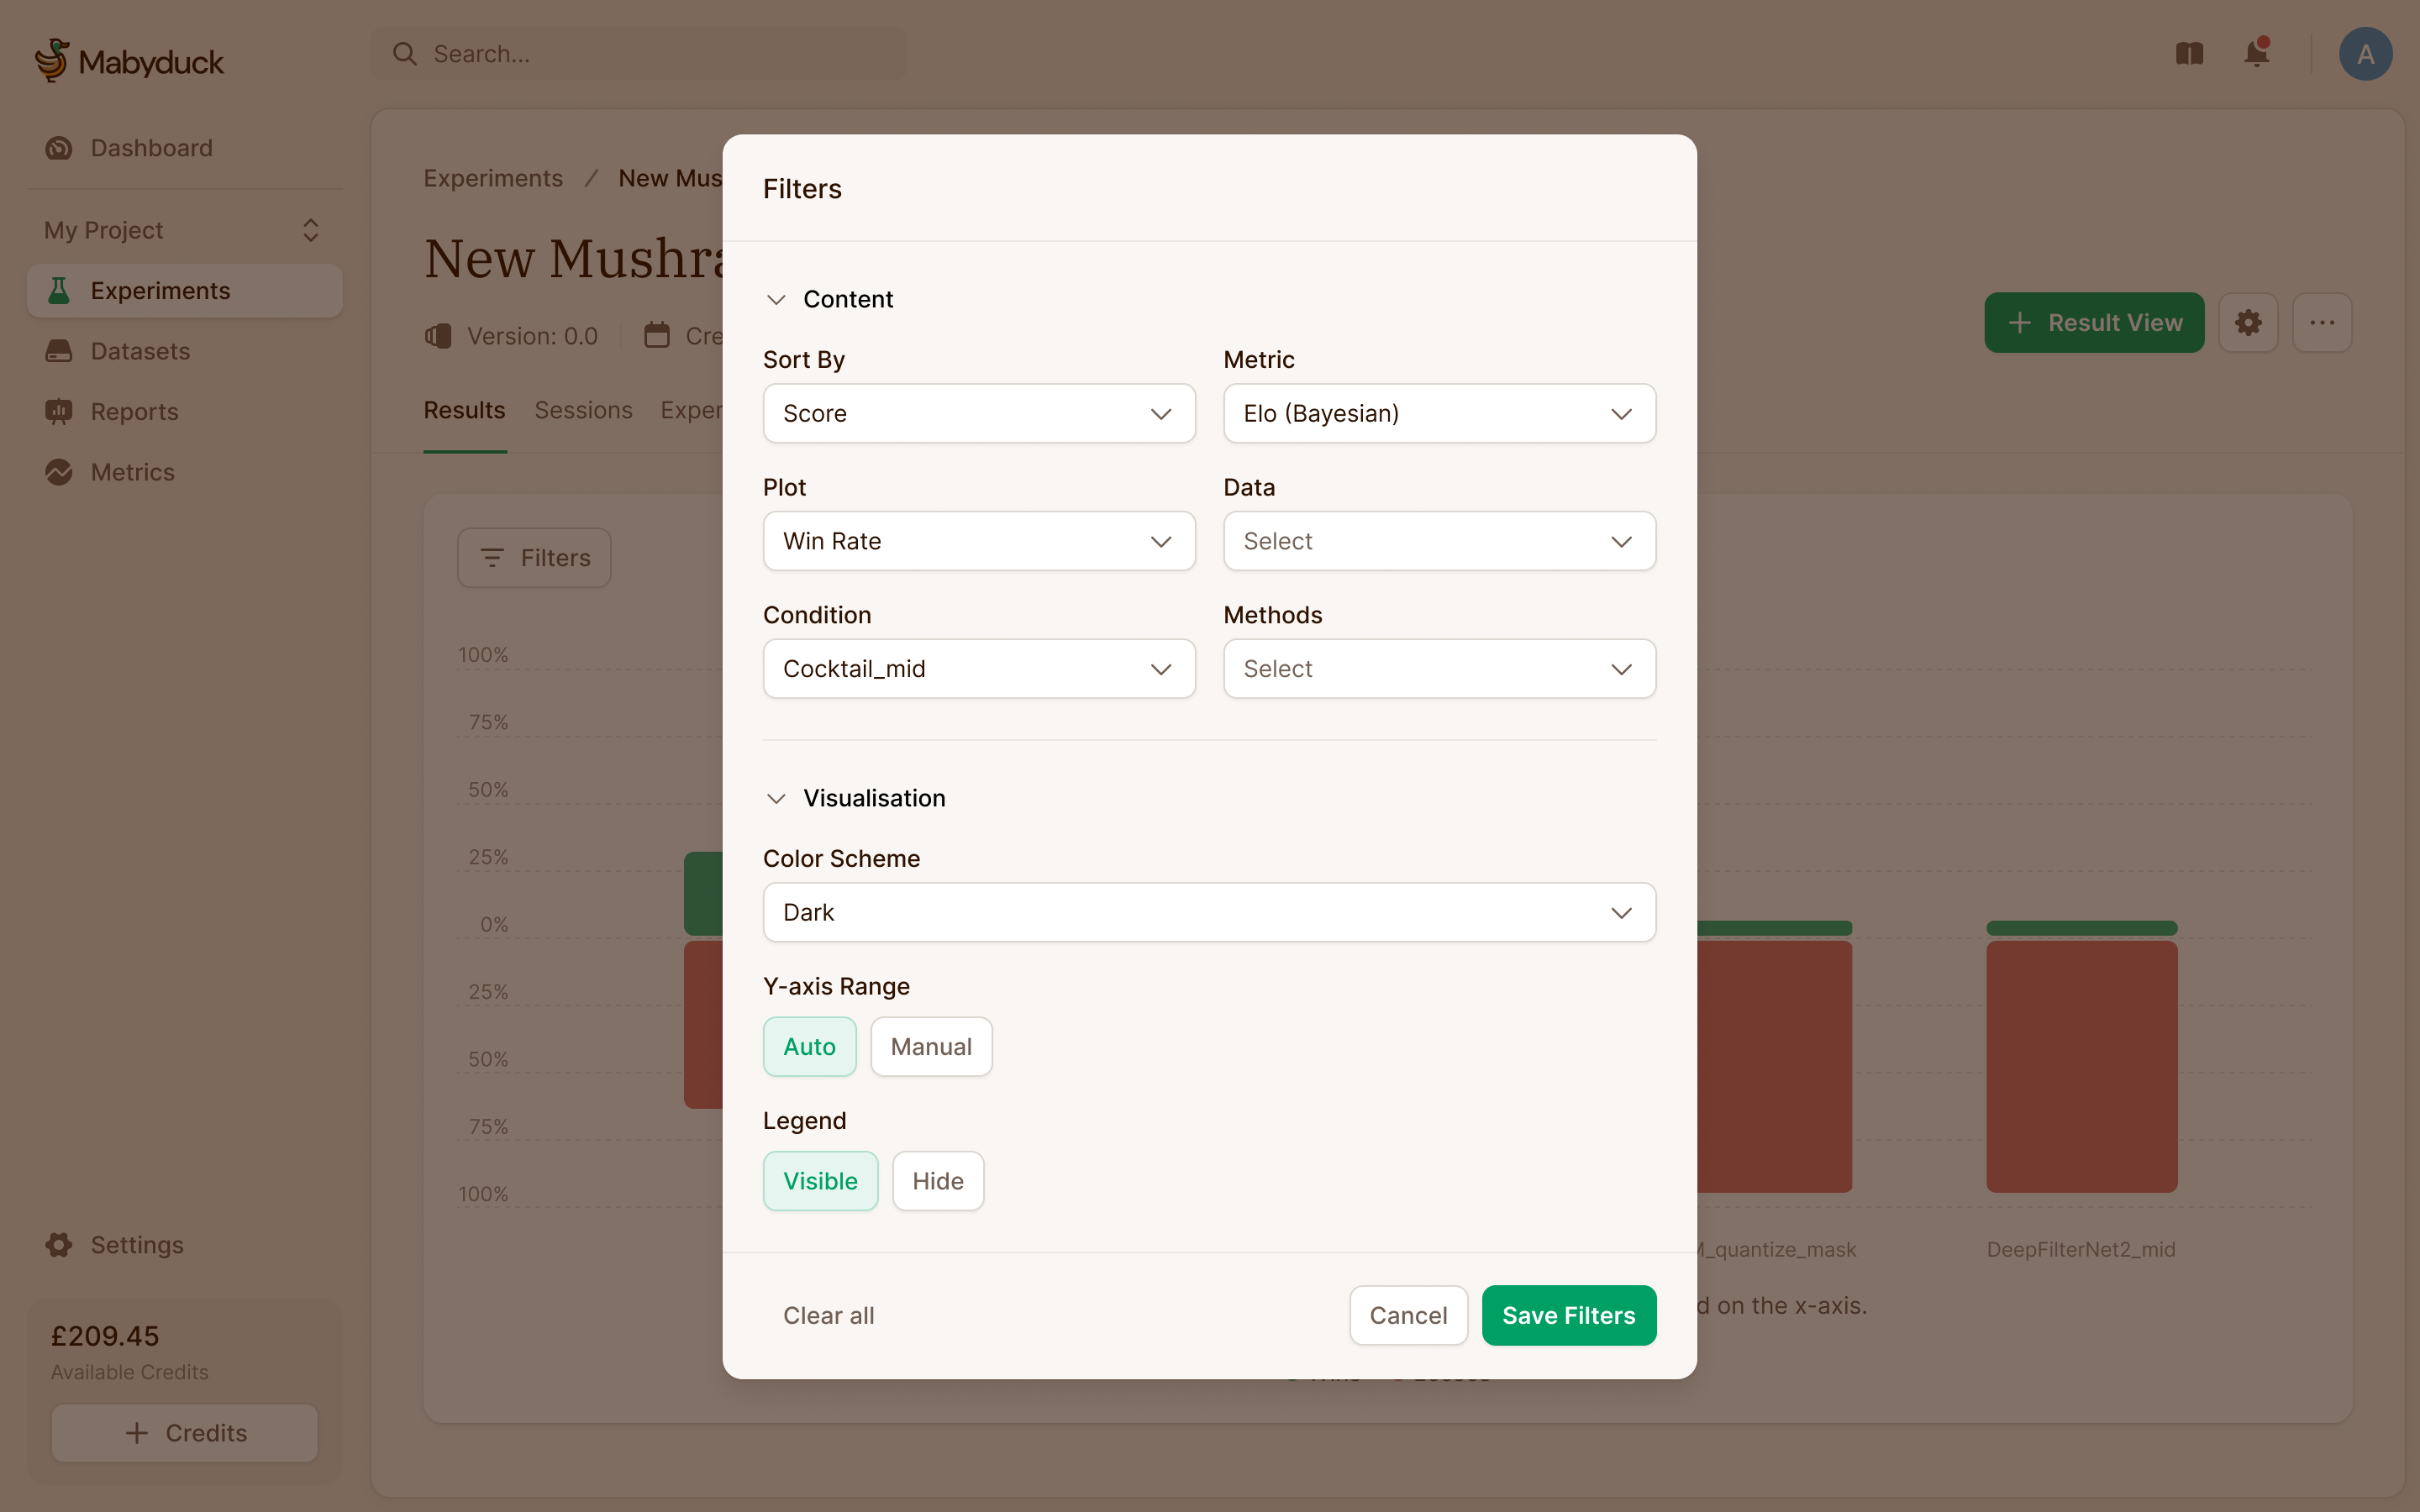
Results needed a similar limit on complexity. I raised the possibility of a dashboard builder with movable, resizable charts. Lucas proposed a smaller interaction: configure one plot, add it to a list, then configure another. It would give researchers several views of the results without the implementation cost of keeping a whole dashboard editable at once. We developed the controls around that approach.
Flock is where the raters come from
Mabyduck had always borrowed its raters from crowd platforms like Prolific. In 2026 Lucas brought us back to design its own: Flock, where people sign up, take studies and get paid. People had asked to join before there was anything to sign up to.
A crowd platform profile is mostly demographics. A Flock profile cares more about equipment and senses: how good your headphones are, whether your screen does HDR, whether you can reliably assess the kind of media in the study. Those decide whether your rating of a song or a video can be trusted. Specialists, from audio engineers to graphic designers, get recruited directly.
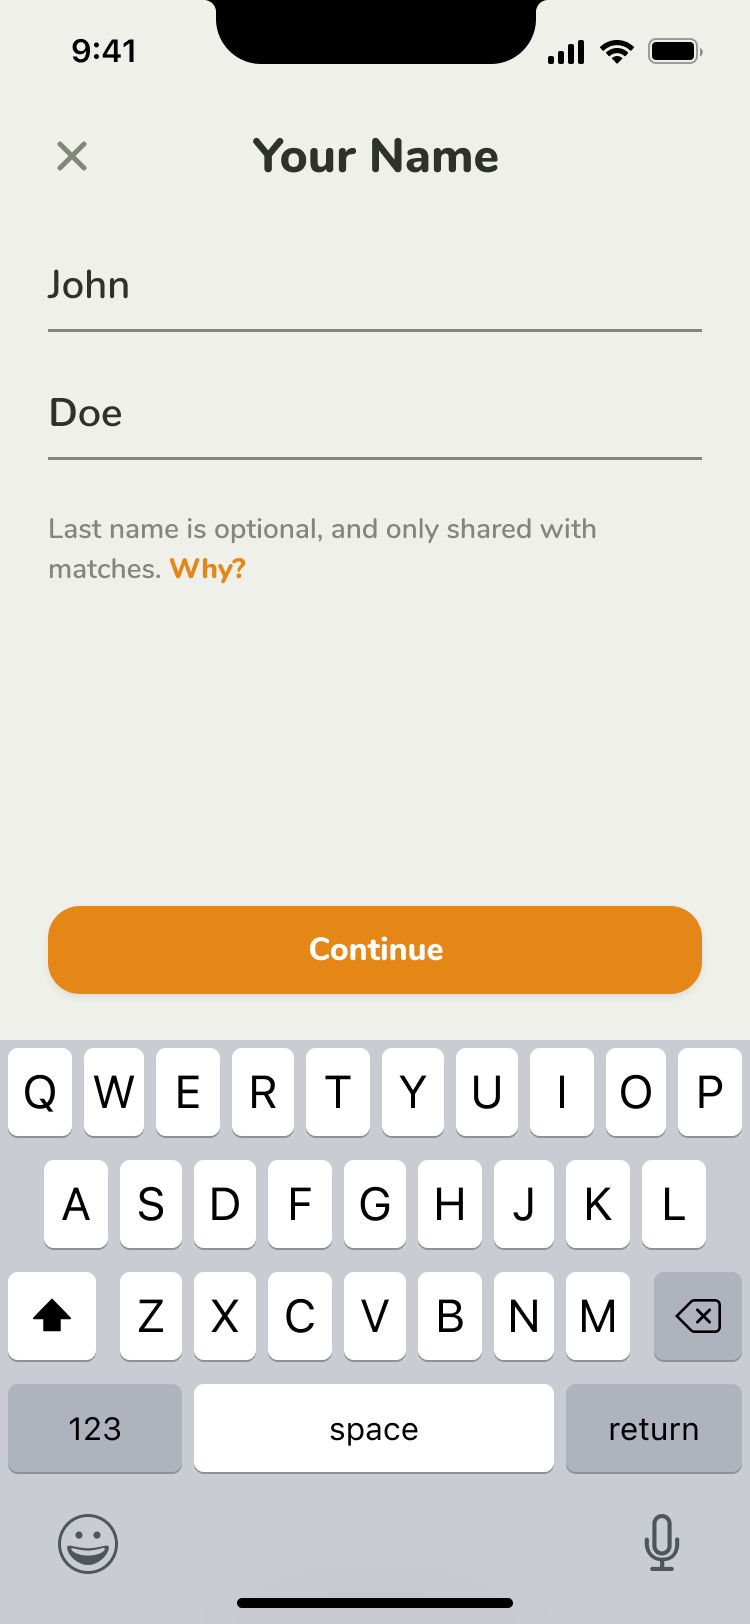
Before a participant sees a study, they finish a few setup tasks: their details, a Stripe account to get paid into, and an identity check. Lucas's note on our first pass was that the "about you" page looked a little too much like a crowd platform, so the direction moved further from it. It's closer to Luma than to a SaaS dashboard, with a flock of bird illustrations, one for each kind of specialist, on a muted, cloud-like background that stays out of the way inside the product.
the equipment a participant uses can matter as much as their demographics
Rubrics turn results into a leaderboard
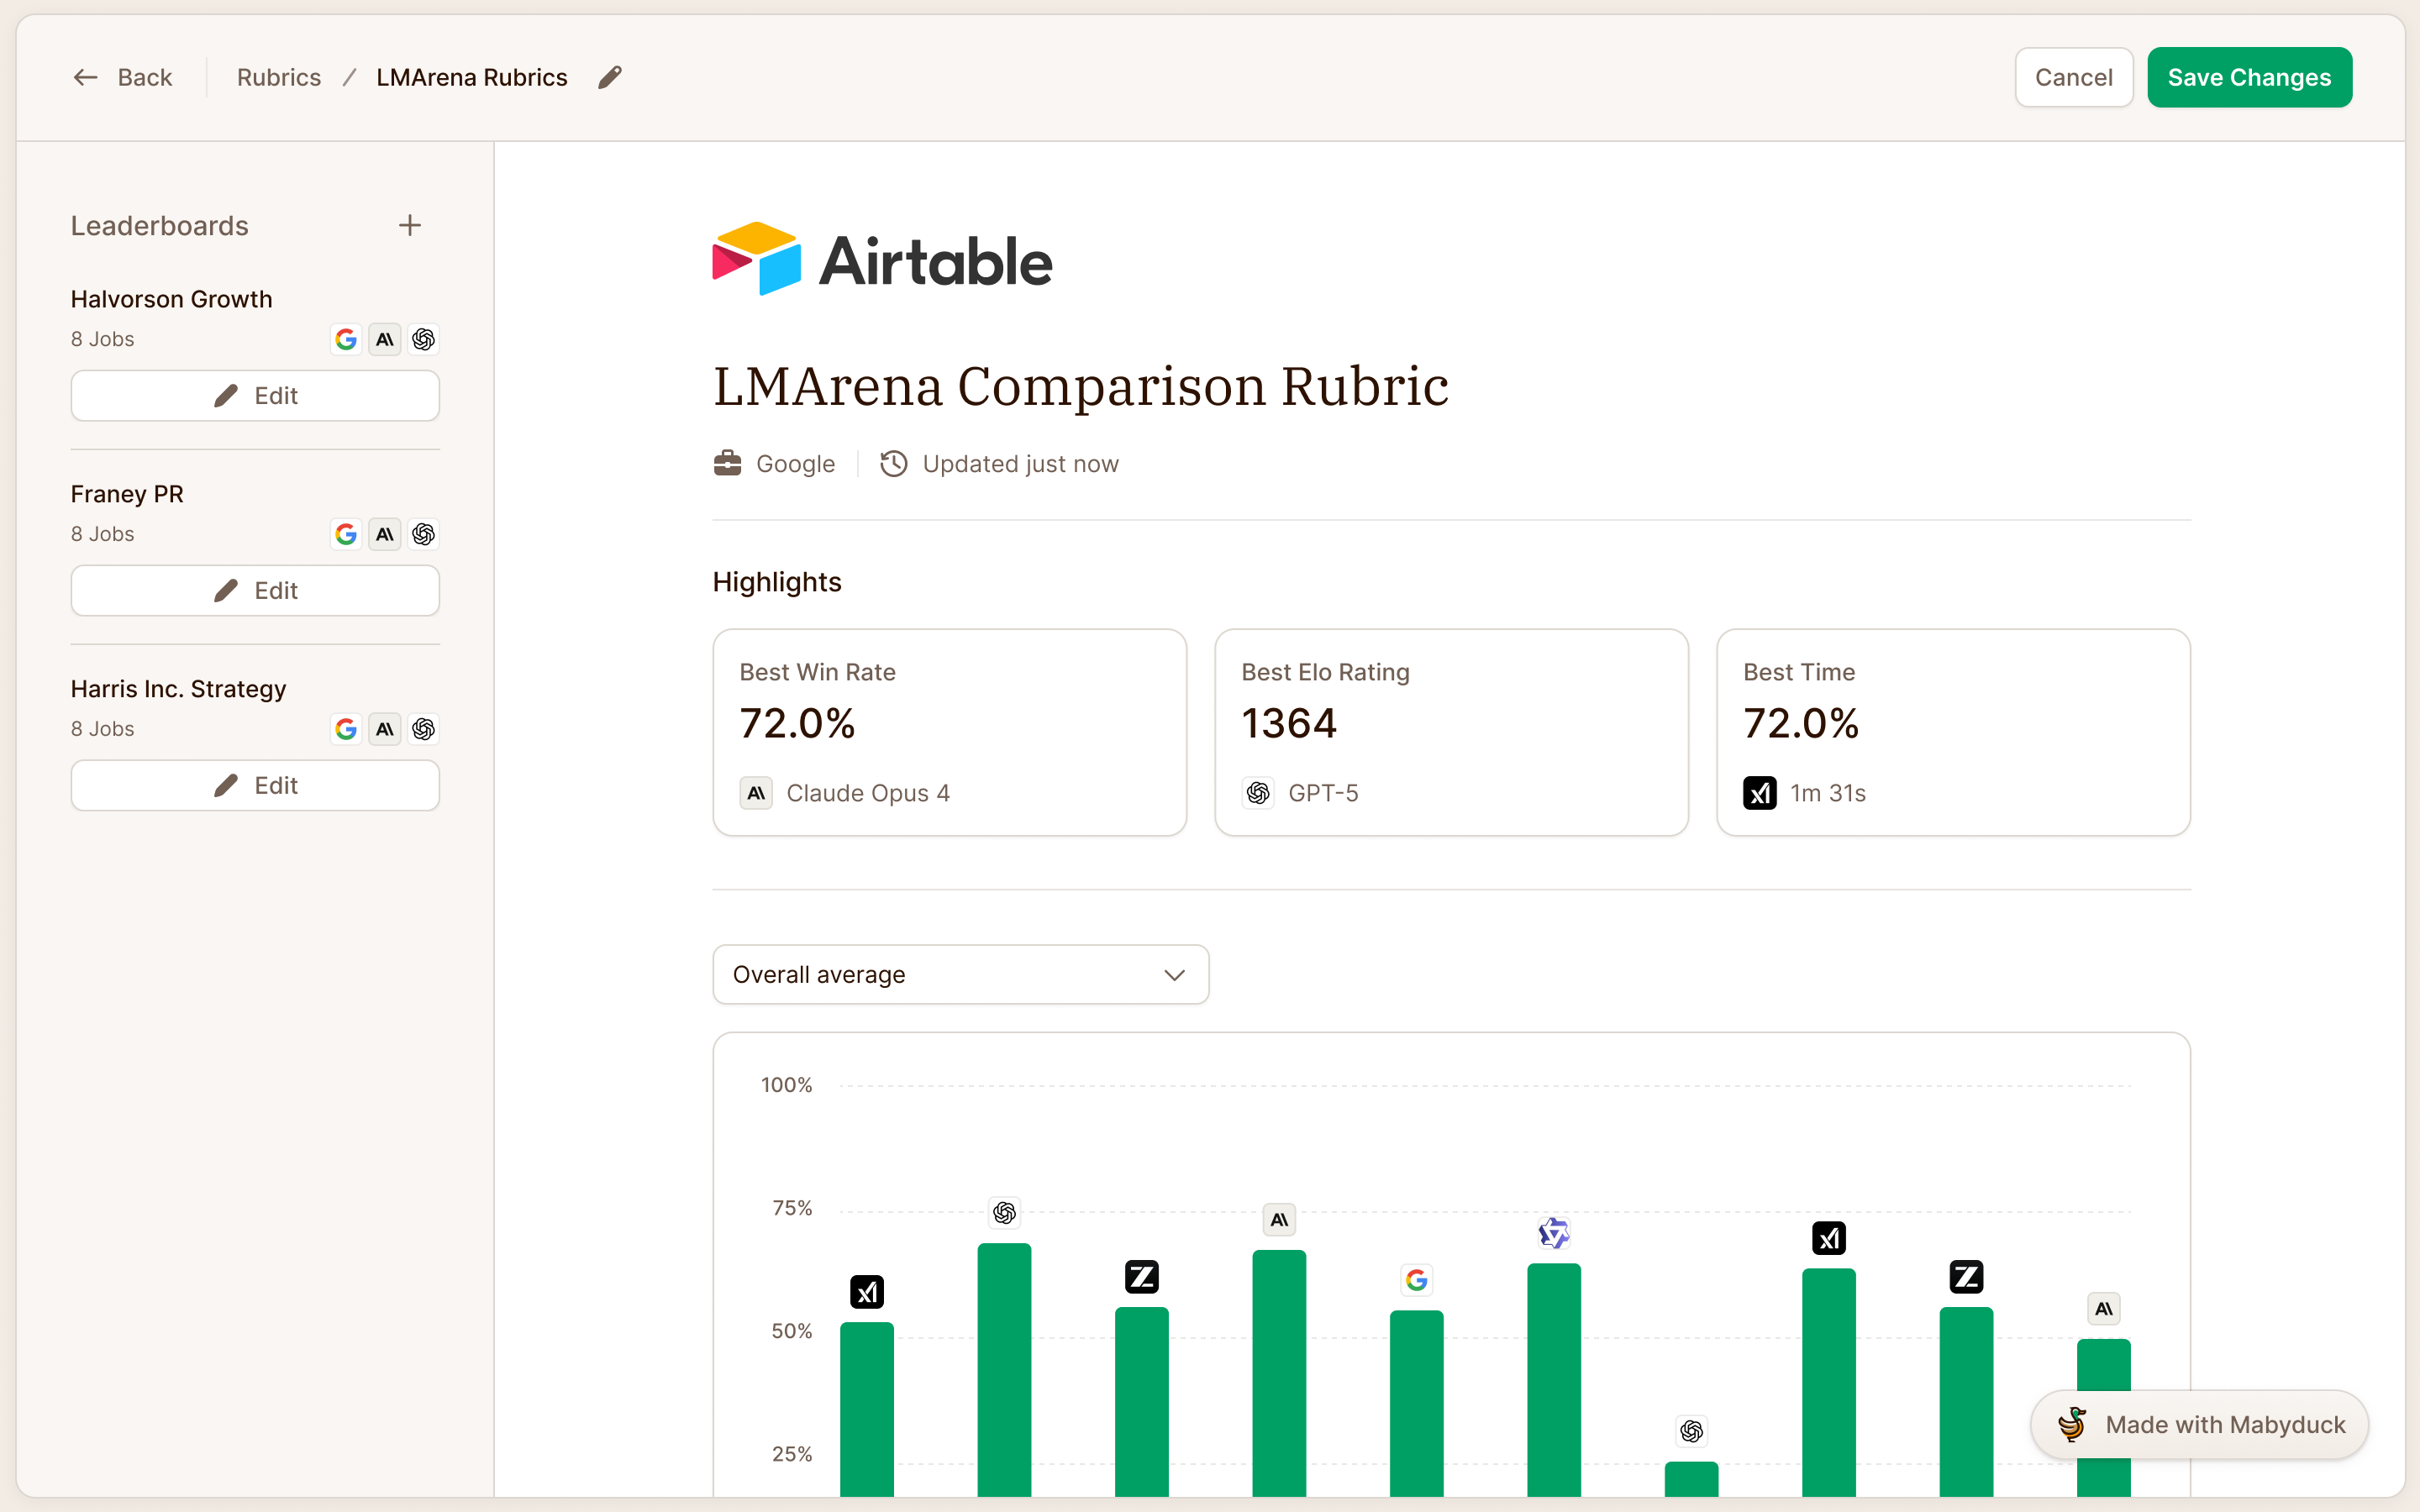
Customers wanted to compare models across many experiments, and to publish the comparison. Rubrics do that. A rubric pulls results from across experiments and jobs into one or more leaderboards, and because it sits above experiments, it has a place of its own in the navigation.
Lucas expected customers to embed rubrics on their own sites. That made publication status more useful than a collection of shareable links with separate permissions. We kept the control to live or hidden, with a visible status beside it. Someone preparing the results can tell whether the page is public without opening a sharing dialog.
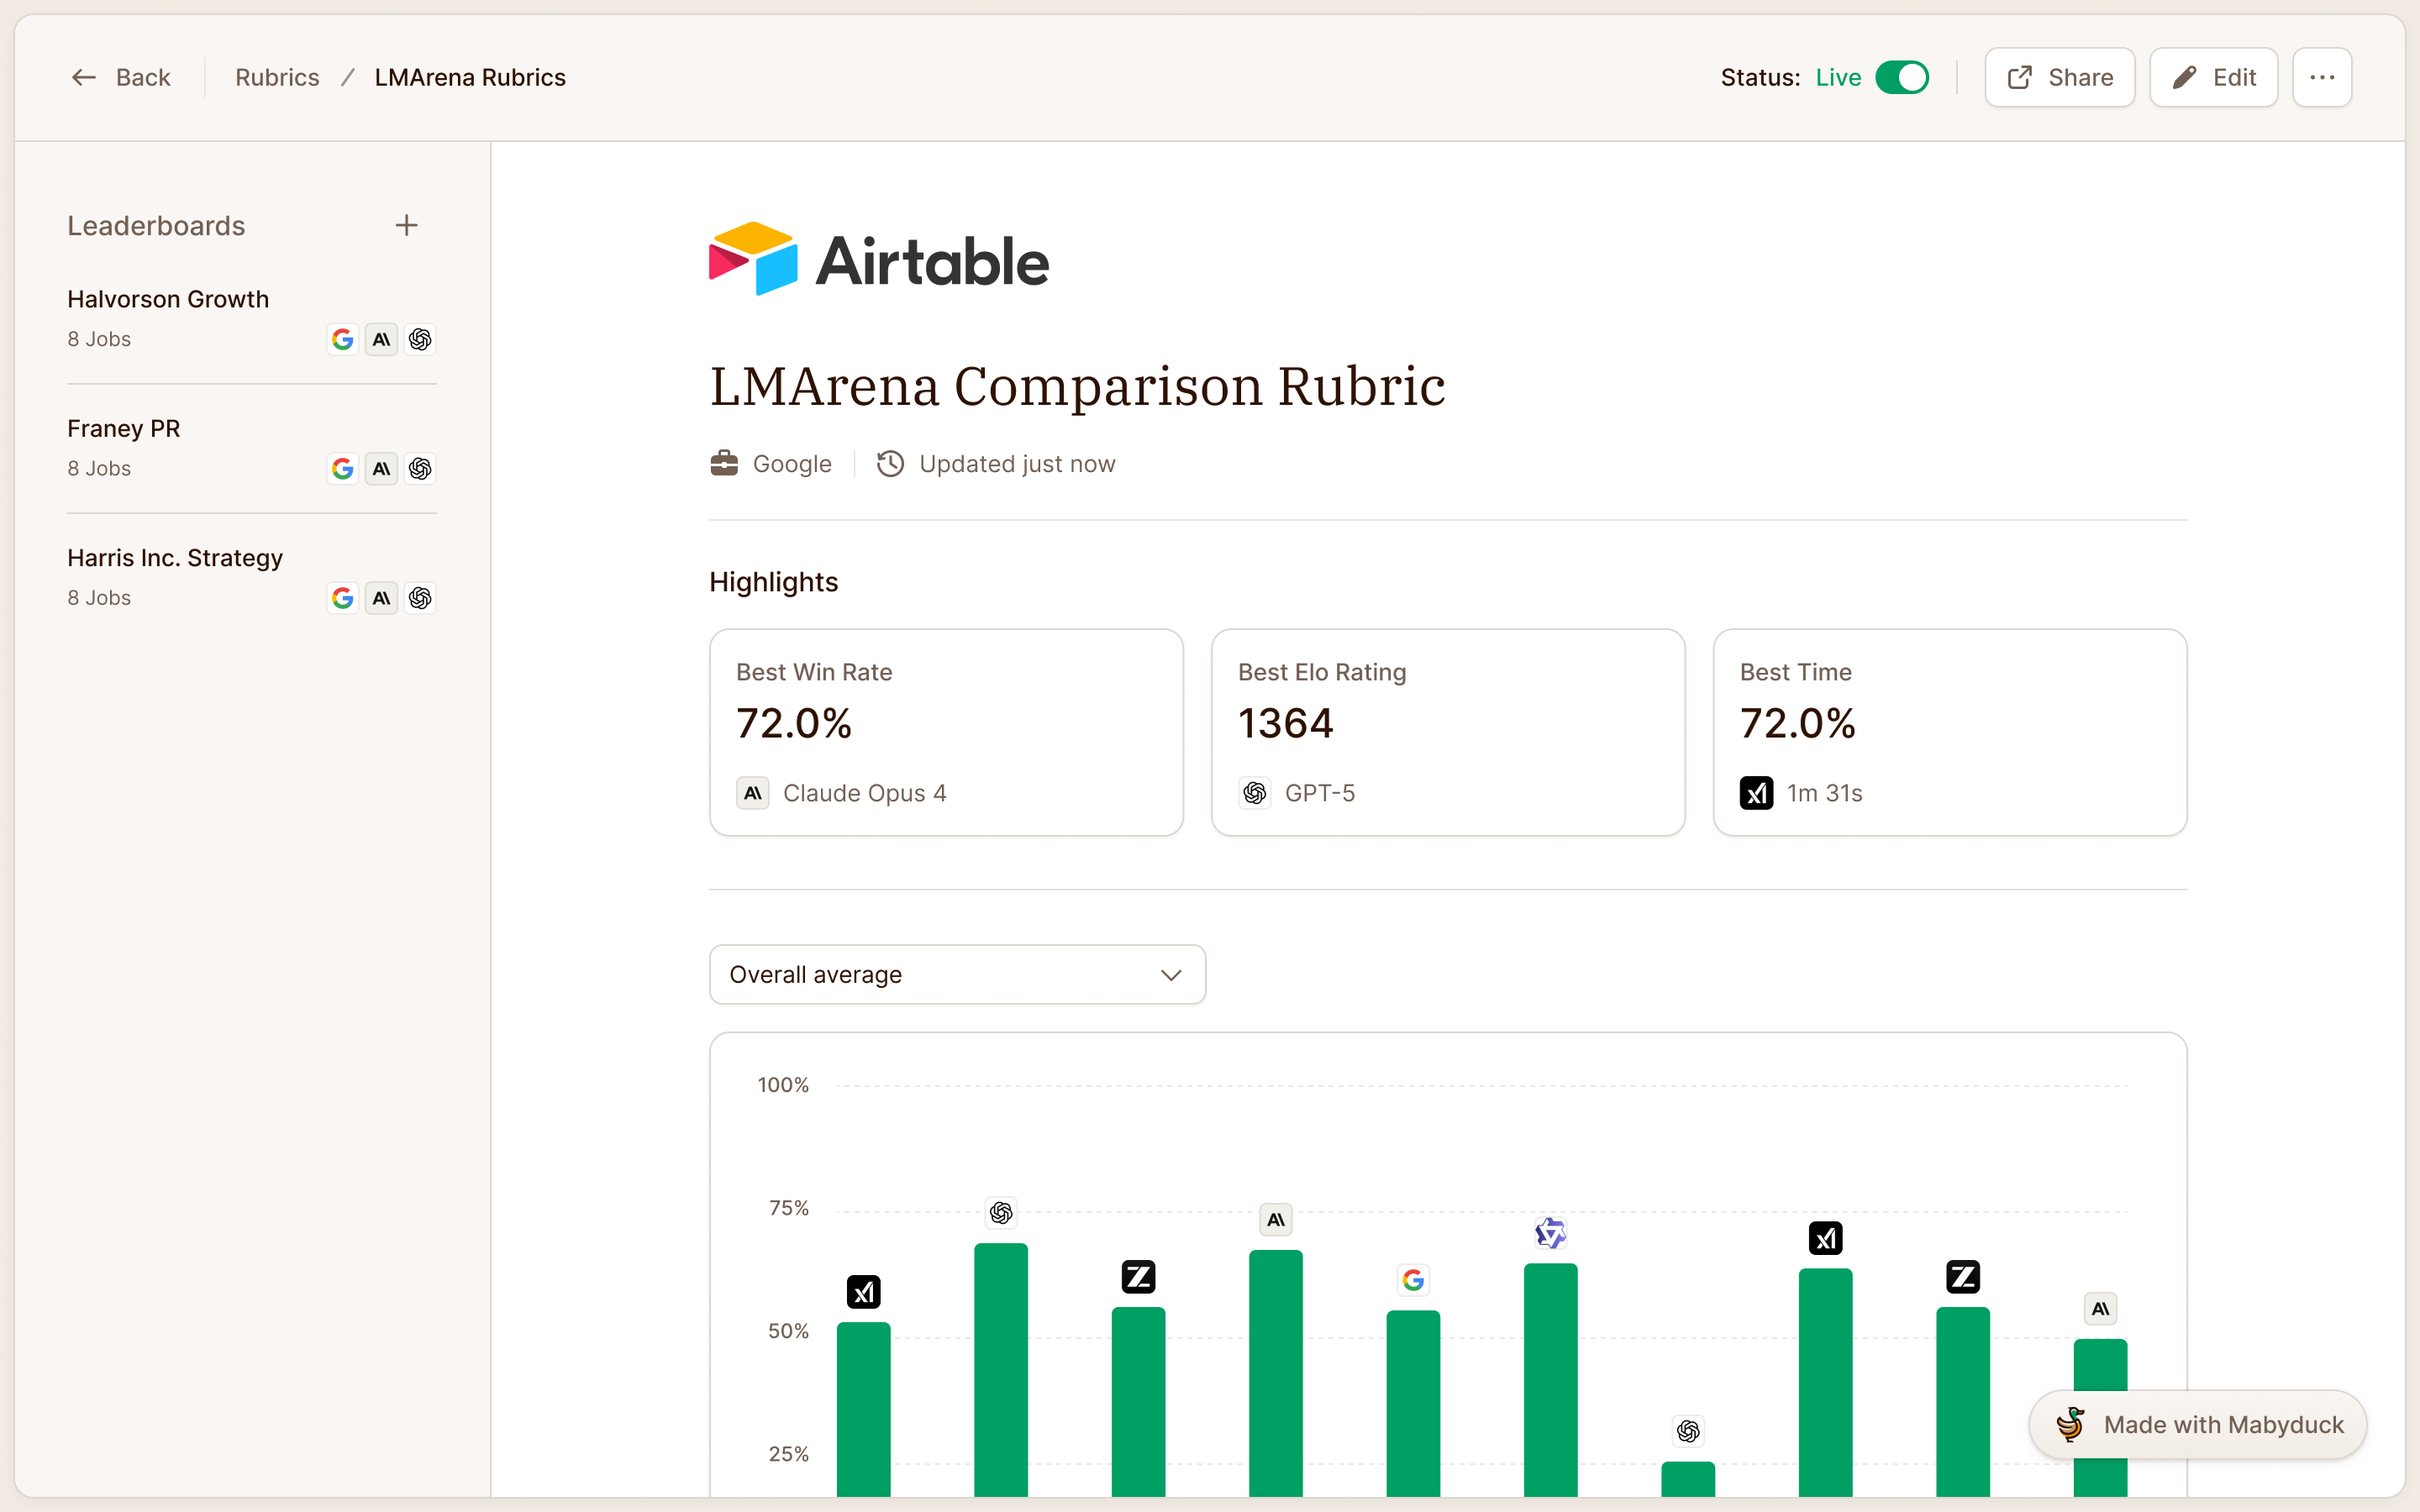
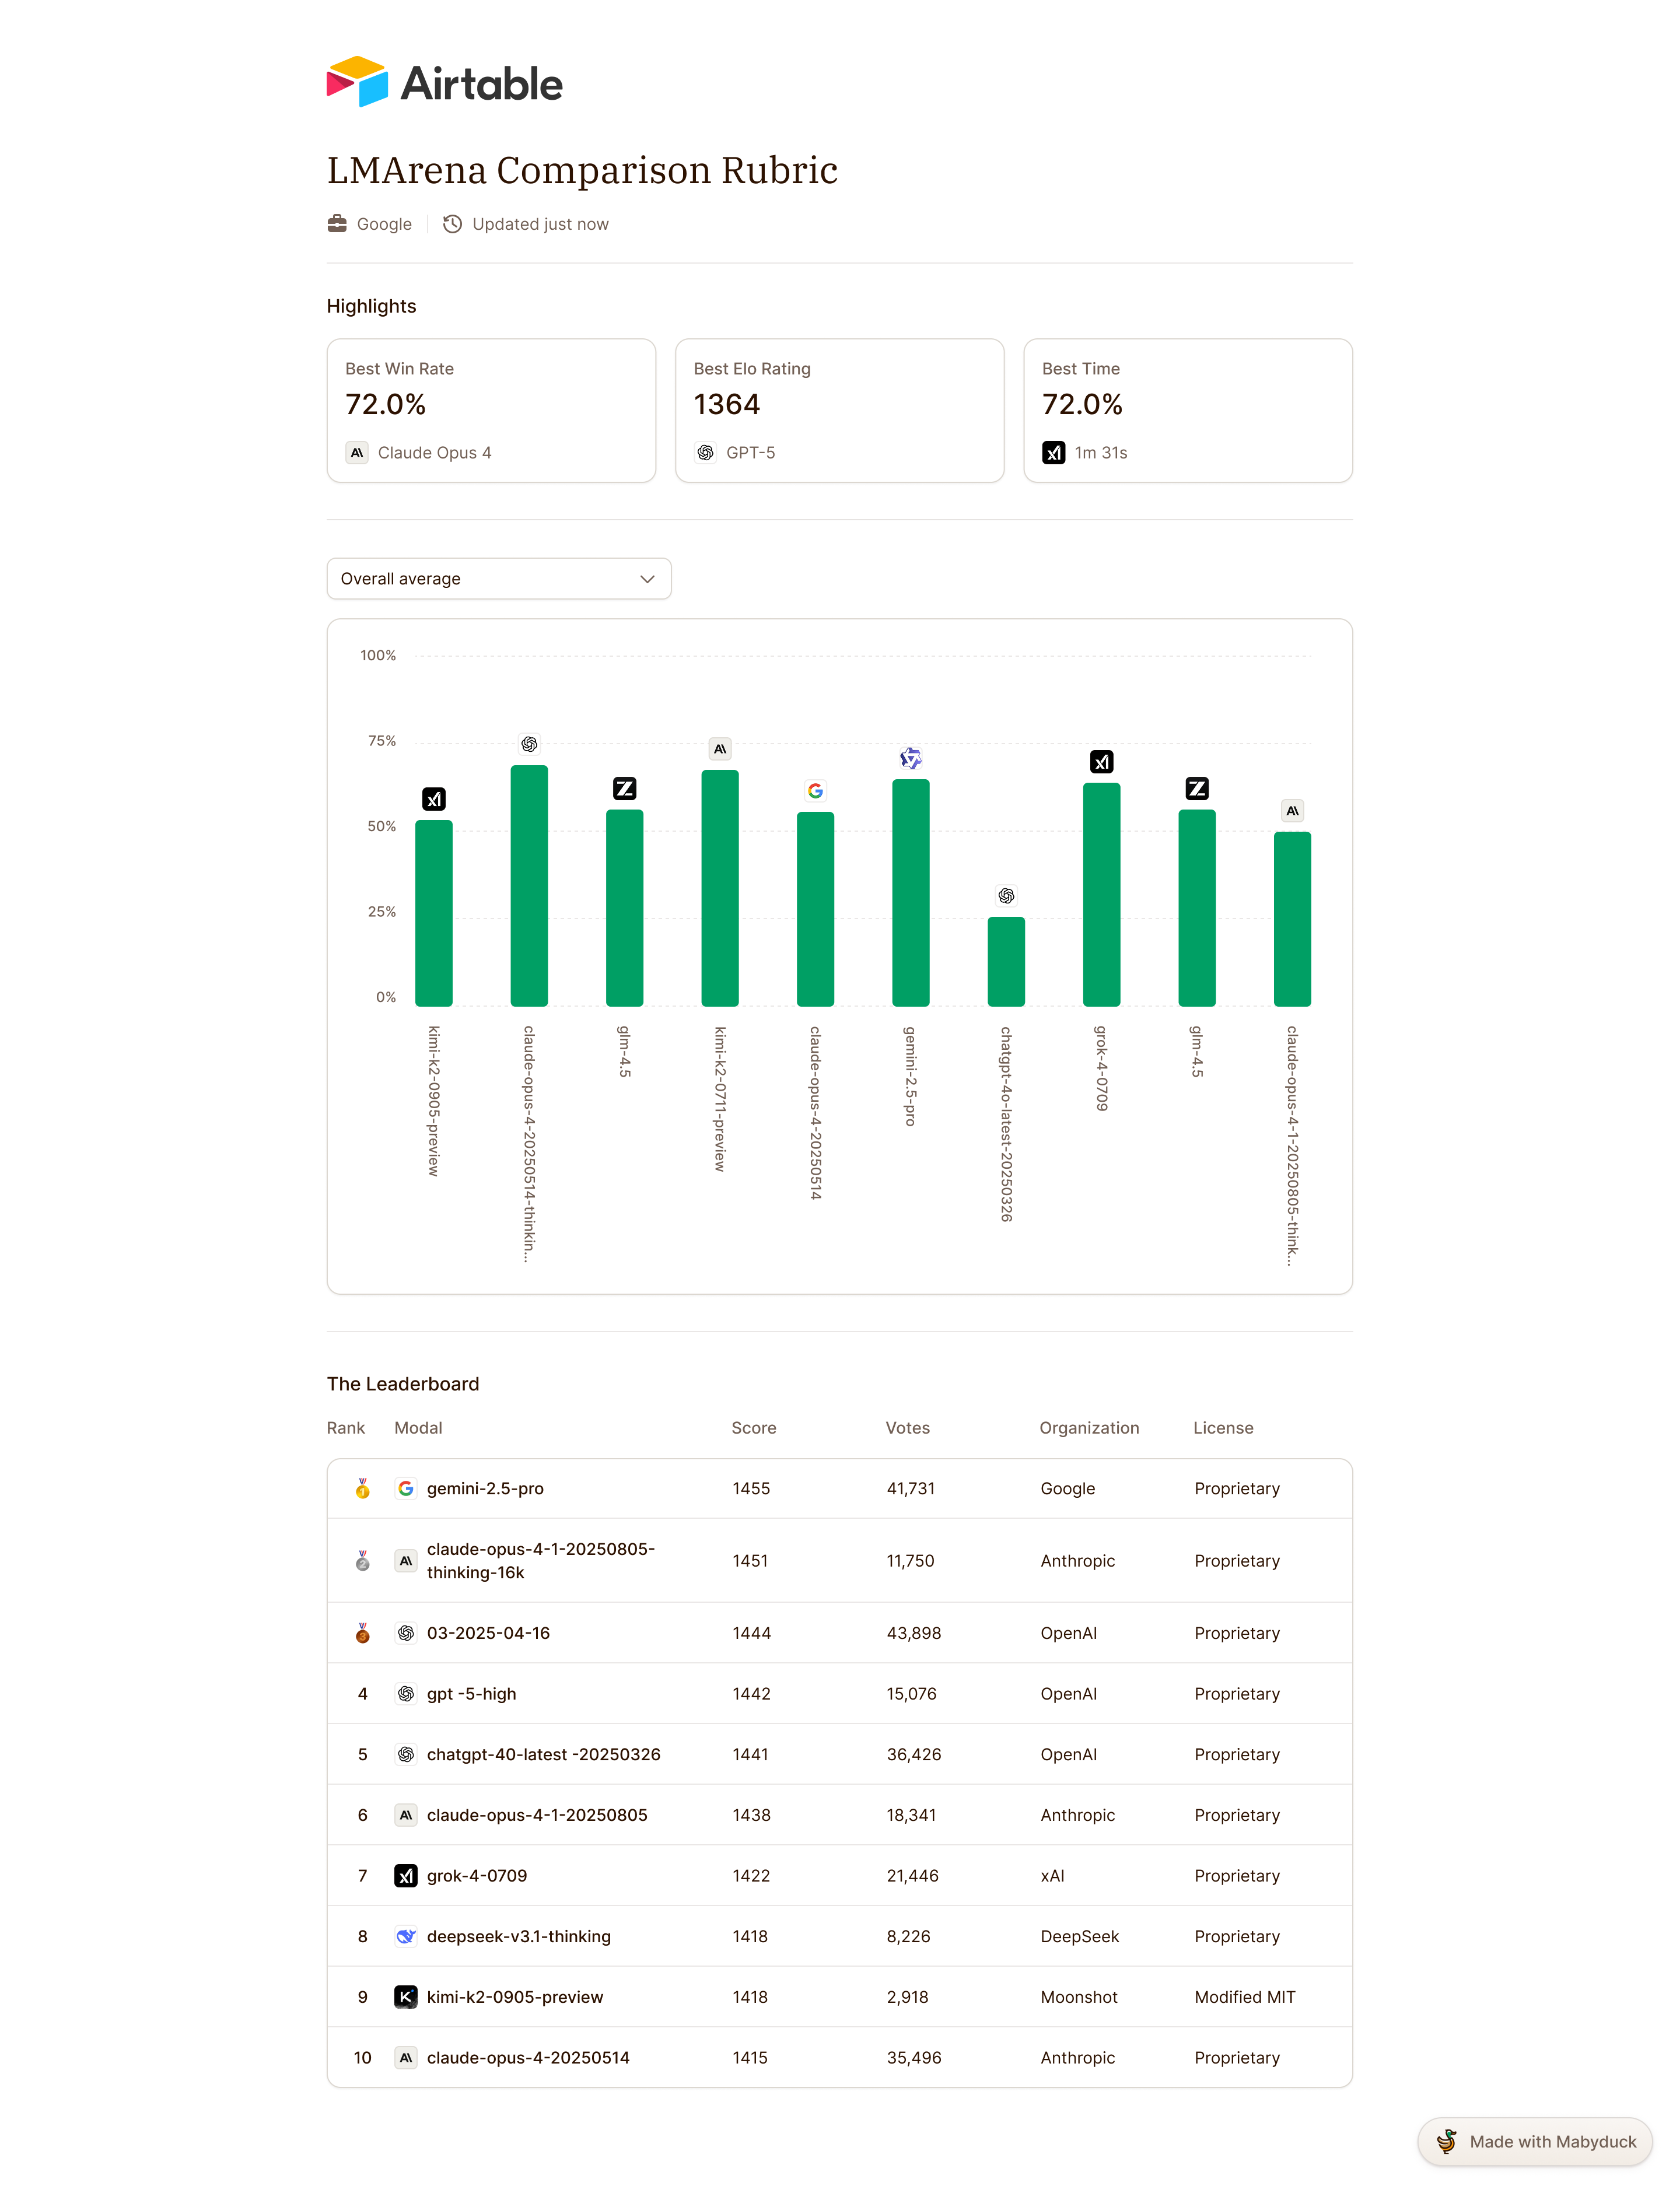
live or hidden, with the publication state visible on the rubric
Mabyduck opened its public, self-serve beta in November 2025.

"Despite the technical and specialized nature of our product, the team at NBS were incredibly helpful in developing its user flows and improved the UX in more ways than just its visual appeal."
More from Mabyduck